
 astronaut
 Pearl
Pearl NEAR Protocol
 Walrus
 Zylo Ecosystem
 Bitcoin
 Hyperliquid
- The Pi crypto price is up by 14.43% in the last 3 days.
- The PI price has surpassed the 200-day moving average and reached the $36 mark.
In the last week of August 2023, the Pi (PI) price recorded an all-time high of $62. The next day, it declined by 34.56%. The PI price attempted many times to sustain this level, but sellers pulled it. Thus, the price melted by 45% in a month.
The Pi price has been in a bearish trend since September. It is declining by forming lower lows and lower highs. It is continuously defending the $30 mark and has risen to the last swing high.
Current Price – $35.59 Price Prediction – $33.46 (-5.04%)
Market cap – $2.45 billion Fear & Greed Index – 82 (Extreme Greed)
Volume – $0.35 million Green Days – 15/30 (50%)
Sentiment – Bullish 200-day EMA – $33.41
Volatility – 3.20% RSI – 70.40
The current market price of the Pi coin is $35.59, which has dropped by 0.61% in the last 24 hours. The market capitalization of the crypto is $2.45 billion, and the trading volume is $0.35 million.
According to our technical analysis, the Pi crypto price is forecasted to drop by 5.04% to reach $33.41 by March 06, 2024. The fear and greed index is 82 (extreme greed), and volatility is 3.20%. The price has performed positively for 15 days in the last 30 days.
The Pi Coin Price Has Formed a Descending Triangle Over Daily Timeframe
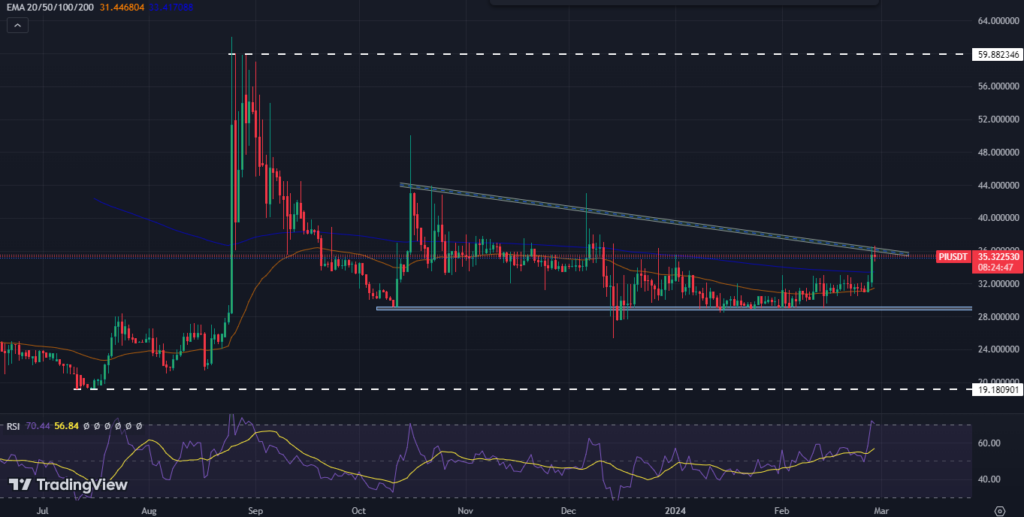
According to the technical chart, the Pi price has formed a descending triangle. It is continuously facing resistance from the trendline. Crypto’s price has surpassed the 200-day moving average and reached the trendline.
According to the price action, the Pi crypto price faces resistance from the trendline and forms a negative candlestick. If it falls and slips below the 200-day moving average, the sellers may pull the price to the strong support level of $30.
If the sellers become interested and the price fails to defend the support level of $30, it may melt to the $20 mark. A bearish trend for the next few months can be expected.
Technical Analysis of the Pi Crypto Price Over 4-H Timeframe
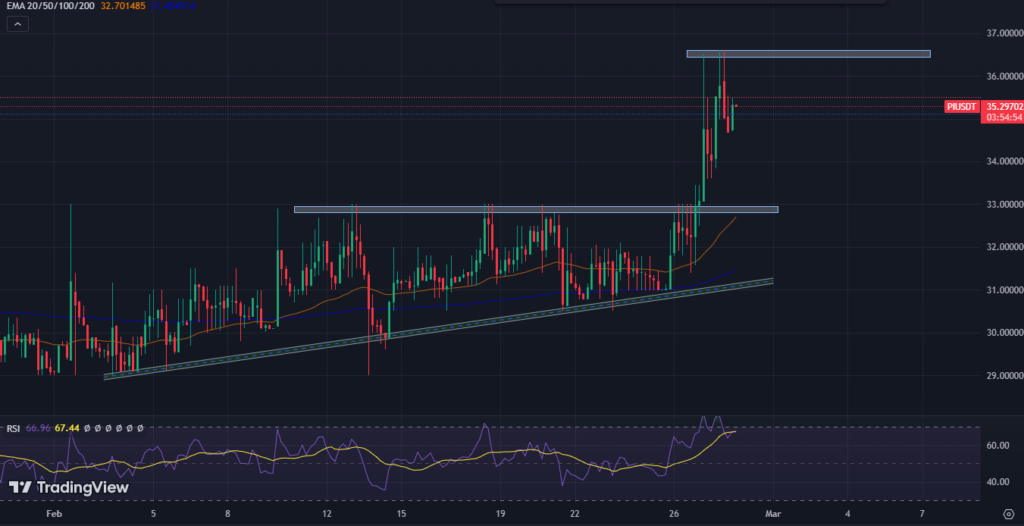
In a 4-H time frame, the PI price formed an ascending triangle and rose by 9.85% after the breakout. It is facing resistance from the $36 mark and generating a pullback. If the price manages to surpass the recent high, a buying momentum can be possible.
On the other hand, if the price fails to sustain the $36 mark and falls, it may easily melt to the $33 mark in the next few days.
The PI price has surpassed the significant moving average, which showcases the bullish trend. The RSI is at 70, which has suddenly jumped to the overbought zone, indicating a bullish trend.
Conclusion
Pi Coin price has been in a bearish trend and facing resistance from the trendline. According to the analysts, the crypto price may generate a bullish signal over $40, and a selloff can be observed below the $30 level. Based on the technical indicators, buyers are dominating, and the price may gain bullish momentum for the next few days.
Technical Levels
Resistance: $36.00 & $43.00
Support: $31.00 & $27.60
Disclaimer
This article is for informational purposes only and provides no financial, investment, or other advice. The author or any people mentioned in this article are not responsible for any financial loss that may occur from investing in or trading. Please do your research before making any financial decisions




