
 NEAR Protocol
 Bitcoin
 Aerodrome Finance
 Pearl
Pearl Uniswap
 Quantus
 Pudgy Penguins
- The Rollbit price has extended to the 20-day EMA from the bottom.
- A bearish crossover occurred between the 20-day and 200-day EMAs.
- The RLB price has surged by 10.26% in the last 24 hours.
The Rollbit price has struggled between the $0.100 and $0.300 hurdle from August 2024. Recently, the price has taken support at the $0.100 mark and extended to significant moving averages. Recently, the Rollbit coin price has faced resistance from the $0.300 mark and dropped by 64% in 20 days, indicating the bears’ grip.
Rollbit coin price has been facing resistance from the $0.300 mark and shows a fall of approximately 60% every time. The RLB crypto price fails to sustain over the 20-day EMA, which shows that sellers are strong, and currently, the price is facing resistance from the 200-day exponential moving average.
At the time of trading, the RLB price was trading at $0.180, which has risen by 10.26% in the past 24 hours. The market capitalization is $357.80 million, and the 24-hour trading volume is $1.72 million.
Rollbit Crypto Volume Analysis
The volume analysis suggests that Rollbit Crypto has received $1.41K volume, which is about 80% less than the previous days. The fall in trading volume shows a negative forecast, and the price may decline in the next few days. In the last 2 weeks, the trading volume has dropped from $8 million to $1.72 million, and the price has performed accordingly.
Rollbit Crypto Social Dominance and Social Volume Analysis
In the last few weeks, the graph of social dominance and social volumes suggests that awareness on social media like X, Telegram, and Instagram has decreased, and the price has also shown the sellers’ grip. Suppose the social dominance and social volume increase; the price may gain bullish momentum.
Rollbit Crypto Price Technical Analysis Over Daily Timeframe
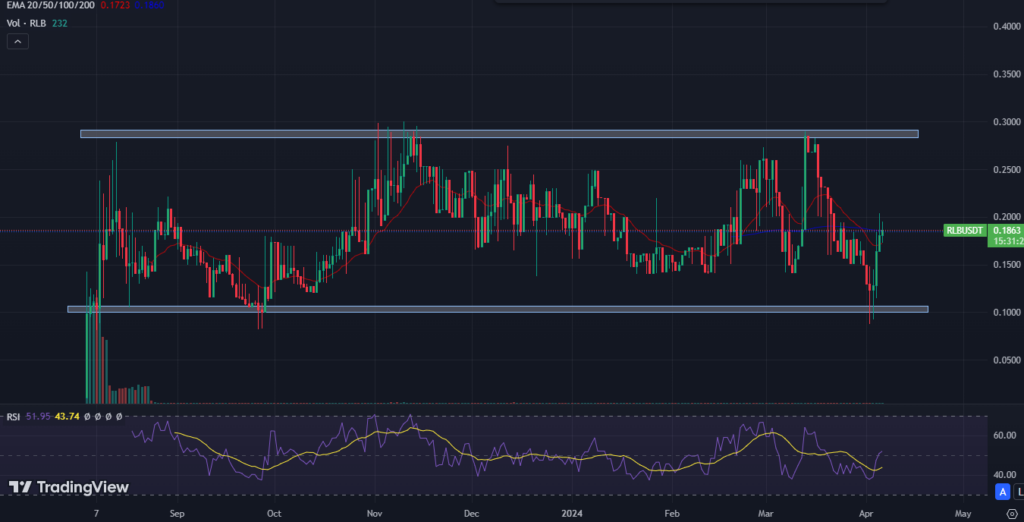
The Rollbit coin price has been struggling in the parallel channel on a daily time frame. It is bouncing back from the support level of $0.100, has surpassed the 20-day EMA, and is facing resistance from the 200-day EMA.
Suppose the RLB coin price sustains over the 200-day exponential moving average, the buyers may eye for the resistance level of $0.300. If the RLB price surpasses the $0.300 mark and trading volume increases, it may record a new all-time high. Suppose the trading volume supports, the price may gain bullish momentum in the long term.
If the Rollbit crypto price faces resistance from the 200-day exponential moving average, it may melt to the support level of $0.100. If the RLB price fails to defend the $0.100 mark, buyers will lose momentum, and a new all-time low can be seen.
According to the technical indicators, the RLB price is trading below the 200-day exponential moving average, indicating the bears’ grip. The RSI is at 52. A bullish crossover between the RSI and the RSI-based moving average has been generated.
Rollbit Crypto Price Analysis Based on Technical Indicators
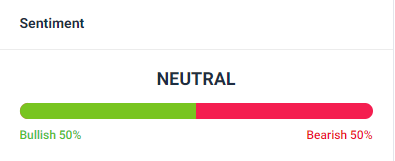
Based on the April 06, 2024 data, the RLB coin price prediction is neutral, with 15 technical indicators suggesting bearish momentum while 15 favoring bullish momentum.
Conclusion
According to the Rollbit price chart, bulls and bears have been fighting for dominance for a year. RLB crypto price has been struggling between the $0.100 and $0.300 levels. According to the analysts, a buying momentum can be generated over $0.300, and a selling signal can be generated below the $0.100 level. The technical indicators suggest a neutral momentum.
Technical Levels
Resistance: $0.250 & $0.300
Support: $0.140 & $0.100
Disclaimer
This article is for informational purposes only and provides no financial, investment, or other advice. The author or any people mentioned in this article are not responsible for any financial loss that may occur from investing in or trading. Please do your research before making any financial decisions.




