
 Bitcoin
 Quack AI
 Pudgy Penguins
 Quantus
 Solana
 Injective
 NEAR Protocol
- The BTC crypto price is performing under a bullish flag pattern and is on the verge of a breakout.
- Moving averages suggest a strong bullish signal in the current trading phase.
- Bitcoin price has surged over 9% in the last seven trading sessions.
Bitcoin (BTC) is decentralized technology’s first open-source digital asset or cryptocurrency. The main goal of this project is to offer online payment transactions without the need for a traditional finance system.
In recent times, the BTC price has shown enormous growth, which has intrigued many traders and investors to jump in. The crypto also created an all-time high price level.
Will Sellers Succeed in Maintaining Congestion in the Current Session?
The BTC crypto price got investors’ attention in February 2024, resulting in a 40% upsurge. Intrigued by this, many other traders and retailers made their remaining attempts in March 2024 and surged the price to 16.55%. Subsequently, the price faced a correction phase in April 2024, resulting in a 14.94% decline.
The crypto price seems to be slowly recovering from the bearish remarks that the price has faced in the previous month. Bitcoin has recovered 10.54% of its price value from the correction period. Compared to the global cryptocurrency market, the BTC price is presently outperforming.
Price Volatility & Social Dominance Analysis
After April 15, 2024, a positive rise in social sentiments toward the price can be seen. That rise also positively impacted the price, reflecting a bullish reversal move in the current phase. Bitcoin has an average social dominance of over 25% on social media platforms, reflecting crypto’s strong influence over users.
Technical Analysis of the Bitcoin (BTC/USD)
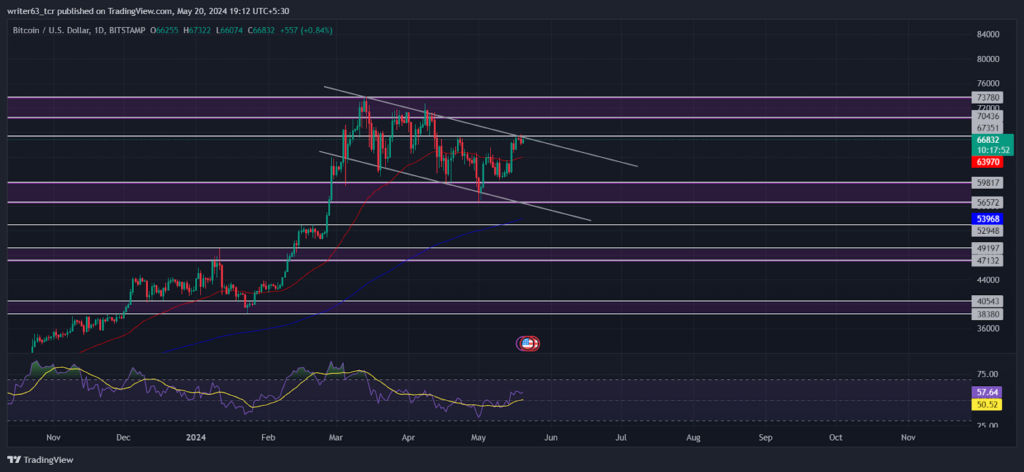
The long-term outlook lies above the key exponential moving averages on the bullish side. The current price rebounded the 50-day EMA from below, indicating the continuation of the bullish trend.
The BTC price performed under a bullish flag pattern in the correction phase. The buyers have shown strength from the $56572 decisional point of interest (POI). They rallied the price by almost 18% to the upper line of the bullish flag.
The price was on the verge of a breakout from that pattern when writing. If the breakout happens, an upsurge can be expected.
Moreover, the relative strength index (RSI) showed strong bullish momentum in the current phase. This reflects that buyers are increasingly gripping the price. The RSI was moving at 58.36 above the SMA line.
Summary
The Bitcoin price has entered a bullish correction phase after creating an all-time high mark on March 14, 2024. Recently, the buyers have shown their strong presence at the $56572 decisional point of interest (POI) and surged the price by 18%. As per the technical speculations, the price can break down from that flag pattern at any time, which can result in the continuation of the bullish trend.
Technical Levels
When writing, the immediate resistance for BTC was $67351, while the $56572 level was the following support. A price rise can be expected if the price breaks above the upper resistance. Similarly, the price can fall further if it slips below the mentioned support level.
Disclaimer
The views and opinions stated by the author or any people named in this article are for informational purposes only. They do not establish financial, investment, or any other advice. Investing in or trading crypto or stock comes with a risk of financial loss.




