
 no crying in the casino
 Pyth Network
 NEAR Protocol
 Starknet
 Quantus
 Pearl
Pearl Bitcoin
- The AIT crypto price is down by 91% from its all-time high price.
- DEAI crypto has less than 10% of its total supply in circulation.
The AIT Protocol market cap has advanced by 26% in the last 24 hours, while the market cap of the Zero1 Labs has advanced by just 12%.
While there has been a surge of 14.8% in the trading volume of Zero1 Labs crypto in the last 24 hours, the AIT protocol has witnessed a decline of 35%, resulting in a traded value of $554K.
The AIT Protocol’s volume/market cap ratio is 3.45%, showing medium liquidity, while Zero1 Labs has a higher liquidity ratio of 6.42%.
Zero1 Labs has a maximum supply of 1.0B DEAI, of which only 91.221M DEAI is circulating in the market. Additionally, the fully diluted crypto market cap is $309.458M, while the fully diluted market cap of the AIT protocol is $29.97M.
From the all-time lows of $0.06469, the AIT crypto price has advanced by 56%, while the DEAI is up by only 24% from its all-time low.
The AIT crypto price volatility is extremely high, resulting in 34%, followed by the volatility of DEAI, which results in 30.3%. The fear and greed index for the cryptos is at 46, which shows fear among the investors. This is not a good sign for the crypto price.
What Do Technical Charts Say About AIT and DEAI?
Both the cryptos are following a strong downtrend followed by a decline below crucial levels.
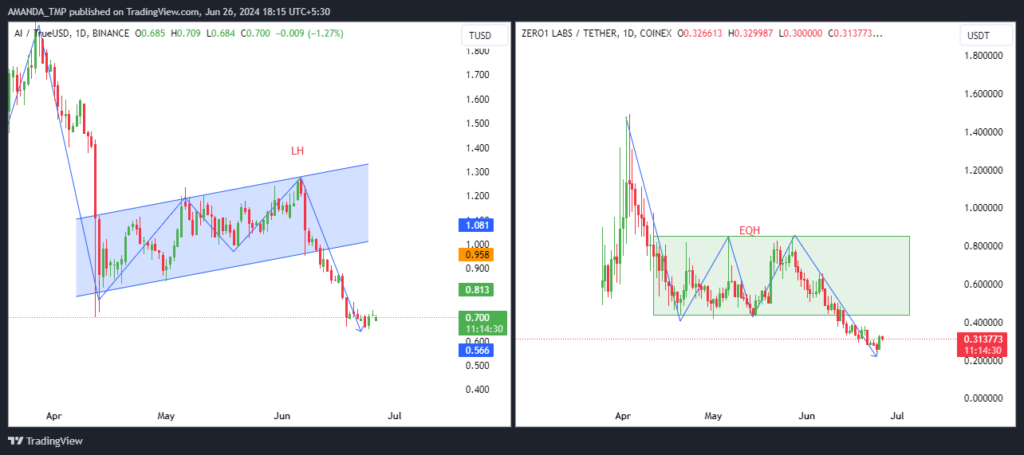
The AIT crypto price has been consistently declining since the beginning of March at press time. The price started to decline after forming a swing high of $2.384. Further, a rising wedge pattern was formed during the declining momentum in the crypto.
The crypto price failed to sustain the pattern and broke down below the same with strong momentum.
DEAI crypto further follows a similar price action, the decline of which is led by a breakdown below the horizontal consolidation zone.
ATI/USDT + DEAI/USDT Chart by TradingView
The 50-day and the 200-day EMAs on the crypto charts are trading in a death cross, followed by the crypto prices trading below the EMAs for a long time. Moreover, multiple candle closings can be seen on the crypto charts during the daily timeframe below the EMAs.
The MACD indicator further supports bears, followed by a strong sell signal on the charts. MACD and the signal line further are trading in a death cross on the charts and have declined to a negative trajectory.
The RSI also follows a strong bearish cycle, followed by a decline below the 14-day SMA and the 50-level on both the crypto scripts’ daily charts.
Summary
AIT and DEAI cryptos are experiencing a significant downtrend, with AIT down 91% from its all-time high and DEAI facing similar declines.
Both cryptos show high volatility and bearish technical indicators, including death crosses and declining RSI. The market sentiment is fearful, suggesting further downside potential.
The support levels for the AIT crypto are $0.025 and $0.50, followed by the resistances of $1.20 and $1.90.
Moreover, the support levels for the DEAI crypto are $0.180 and $0.250; on the higher side, the resistance levels for the crypto are $0.540 and $0.830.
Disclaimer
This article is for informational purposes only and does not provide any financial, investment, or other advice. The author or any people mentioned in this article are not responsible for any financial loss that may occur from investing in or trading. Please do your research before making any financial decisions.




