
 Minter
 Quack AI
 Starknet
 NEAR Protocol
 Sui
Sui Hyperliquid
 Bittensor
- A massive surge in the trading volume of SATS was witnessed over the last 24 hours.
- SATS has advanced to a crucial breakout level.
100% of SATS maximum supply has been unlocked (2.1T 1000SATS). It has resulted in a fully diluted market cap of $345.696 Million.
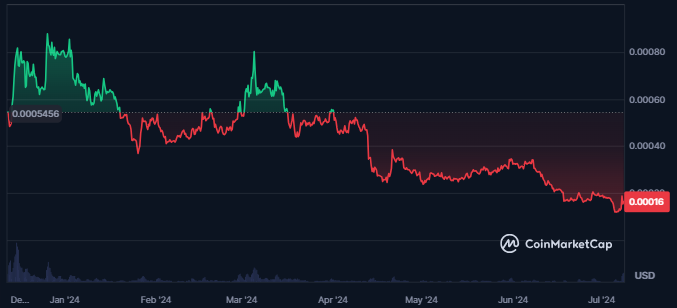
SATS is up 37% from its all-time low price of $0.0001129 which was hit on July 05, 2024. The all-time high of the price of $0.0001878 was achieved on December 26, 2023.
The market cap of the token rose by 22% in the last 24 hours following which the traded volume for the token surged 574%. This further has resulted in a traded value of $251.869 Million.
Market cap ranking as per CoinMarketCap is #144 following while the traded volume ranking of the token is #28. The token is undergoing high volatility (21.66%).
SATS Crypto Derivatives Data Analysis
A strong surge in the open interest of SATS was recorded over the last few days followed by a 24% spike in the last 24 hours.
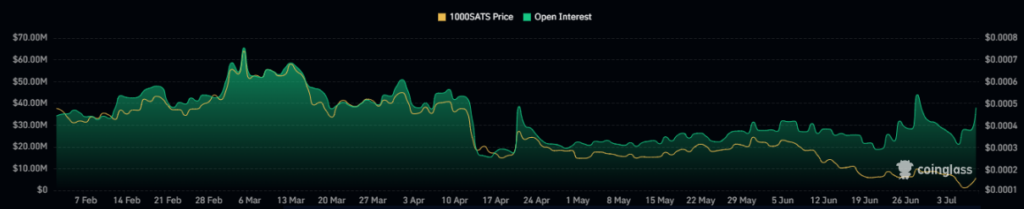
The derivatives trading volume of the token witnessed a huge surge of 630% in the last 24 hours to $1.04 Billion.
Additionally, the recorded long liquidation of the token is worth $1.11 Million against which the short liquidation is worth $1.34 Million reflecting buyers’ dominance over the last few days.
SATS Crypto Technical Analysis
A recent surge in SATS led the price to crucial levels which might determine the price trend in the upcoming days.
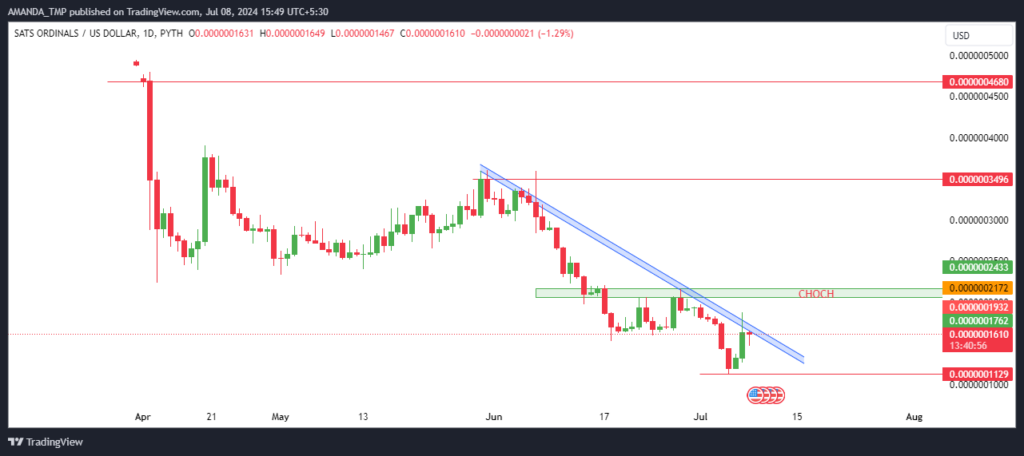
SATS price was declining from higher levels, forming lower lows on the chart. The price also has been declining by following a dynamic trendline from the higher levels.
SATS/USD Chart by TradingView
The Supertrend on the chart is still bearish as the price has been unable to break above the Average True Range.
The price of the token is trading below the 20-day and the 50-day EMAs followed by a bearish crossover on the chart.
The MACD and the signal line further are trading in negative territory below the zero level. Also, the histograms on the MACD indicator show an uncertain behavior.
The RSI also shows weakness in the trend of the token. At press time, it was trading at 41.2. If sustained below 50 for a long time as the 14-day SMA declined below the same.
SATS is showing high volatility with bullish momentum, yet technical indicators suggest uncertainty.
The price must break and sustain above $0.000000210 to confirm a bullish trend. Trading levels are below key EMAs, with bearish signals from MACD and RSI indicators reflecting potential ongoing weakness.
The support levels for SATS are $0.000000050 and $0.0000001100 followed by the resistances of $0.0000003400 and $0.000000460.
Disclaimer
This article is for informational purposes only and does not provide any financial, investment, or other advice. The author or any people mentioned in this article are not responsible for any financial loss that may occur from investing in or trading. Please do your research before making any financial decisions.




