
 Quack AI
 Pons
Pons Lighter
 Sui
Sui NEAR Protocol
 NeoSoul
 Quant
Quant
- The DOG coin price has advanced by 68% from its all-time low price.
- Dog coin, a community-driven memecoin, is built on the Solana blockchain.
Dog coin was most popularly traded on the Jupiter exchange. It can be traded with fiat currencies and other cryptocurrencies.
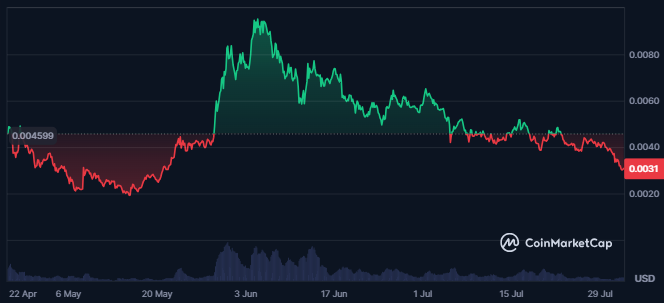
Price Overview Chart of DOG | Source: CoinMarketCap
The Dog coin’s market cap witnessed a decline of 11% in the last 24 hours from the press time. Over the previous 1 month, it declined by 50%. The token’s market cap value was $307.761M.
At press time, the market cap ranking of Dog coin was #215 as per CoinMarketCap. The token’s traded volume value further witnessed an advance of 9.4%, resulting in a traded value of $9.871M. Also, the token’s traded volume ranking was #317 in the global crypto market.
When writing, 100% of the maximum supply of the token was circulating in the market, resulting in 100.0B DOG. Also, the total and maximum supply of the token were the same. This resulted in a fully diluted market cap similar to the coin’s spot market cap.
Dog Coin Derivatives Data Analysis
Higher long liquidations in the coin were recorded in the last 24 hours. This showed the bears’ dominance in the coin’s price.
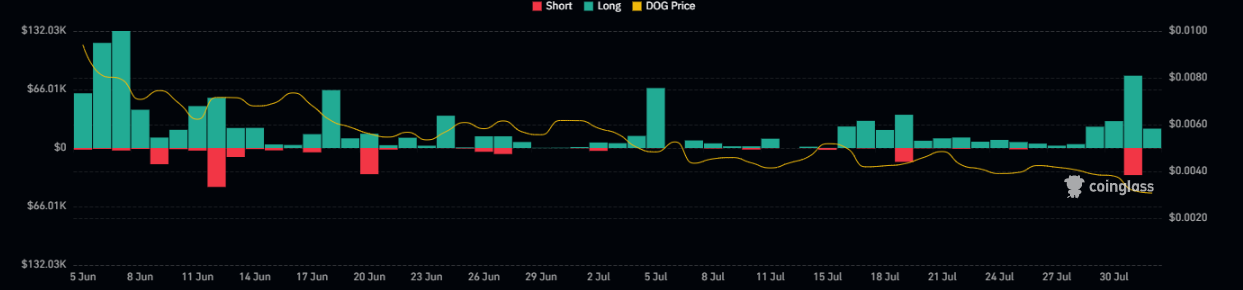
Dog Crypto Derivatives Liquidation Chart | Source: Coinglass
The liquidation of the coin also showed huge long liquidation over a long time. This showed that the Dog Coin witnessed sellers’ dominance for a long time.
In the last 24 hours, longs were worth $43.38K, against the shorts of only $686. Also, a surge of 65% in the token’s derivatives traded volume was recorded, resulting in a traded value of $64.92M.
Despite the surge in the trading volume, the coin’s open interest declined by 9.5%. This showed a decline in traders’ confidence in the coin’s derivatives.
DOG Coin Technical Analysis
After a consistent decline to lower levels, the DOG coin formed a descending triangle pattern. Recently, the coin broke out above this pattern, initially suggesting a potential reversal.
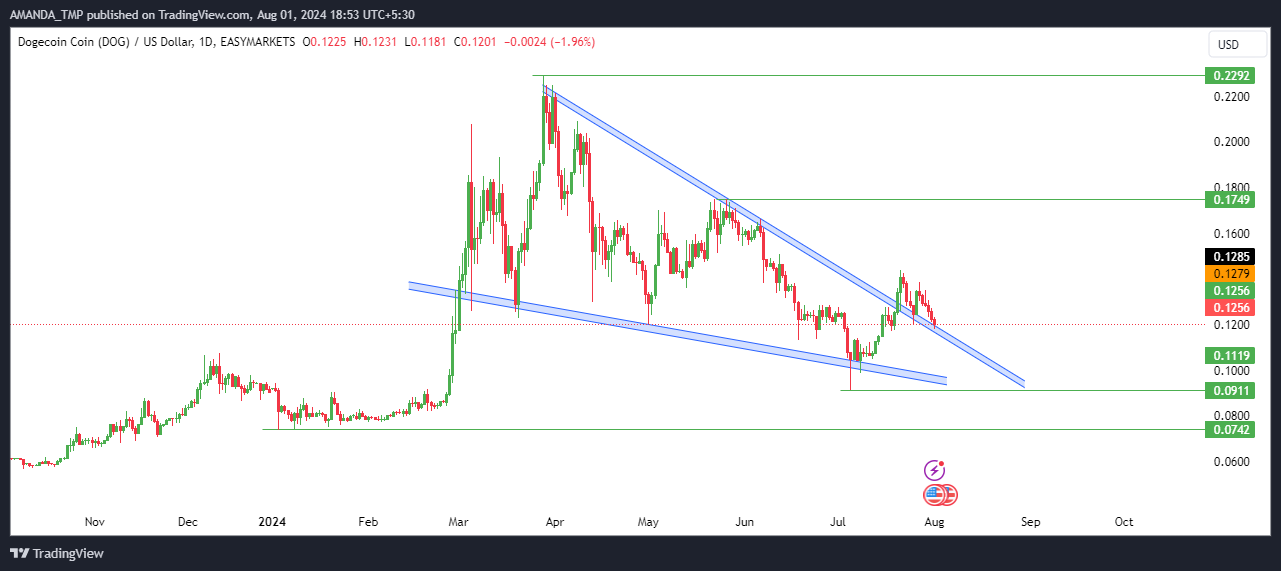
However, the breakout was short-lived, as the price failed to sustain above the pattern. Subsequently, bearish candles have started forming, leading the price to lower levels again.
The following behavior of the coin’s price showed the possibility of further decline to lower levels. This might lead the coin to a better-discounted price, as there is strong support at the lower levels. We might get a better buying price.
DOG Coin Technical Indicators Overview
The DOG coin price has declined below the crucial EMAs plotted on the chart. The 50-day and 200-day EMAs also traded in a death cross.
DOG/USD Chart by TradingView.com
The MACD formed a death cross while its metrics traded in the positive territory. This exhibited uncertainty in the price trend.
The RSI further slipped below the 14-day SMA and 50-level and traded at a level of 54.9 at press time. This exhibited a lack of bullish momentum in the price.
The DOG coin, built on Solana, is experiencing declining momentum despite a 68% rise from its all-time low.
Recently, it faced an 11% market cap drop and failed to sustain a breakout above a descending triangle pattern. Technical indicators show bearish sentiment, hinting at potential further declines.
The support levels for the coin are $0.0740 and $0.090, followed by the resistances of $0.1740 and $0.2290.
Disclaimer
This article is for informational purposes only and does not provide any financial, investment, or other advice. The author or any people mentioned in this article are not responsible for any financial loss that may occur from investing in or trading. Please do your research before making any financial decisions.




