
 Minter
 Pearl
Pearl NEAR Protocol
 Pons
Pons Quack AI
 Quantus
 Sui
Sui
- A larger number of shorts were liquidated in the Zcash token in the last 24 hours.
- ZEC token price was down by 99% from its all-time high price of $5941.
Bitcoin and Ethereum outperformed the Zcash token price in the last 1 year. Despite this, the token price traded above the 200-day EMA.
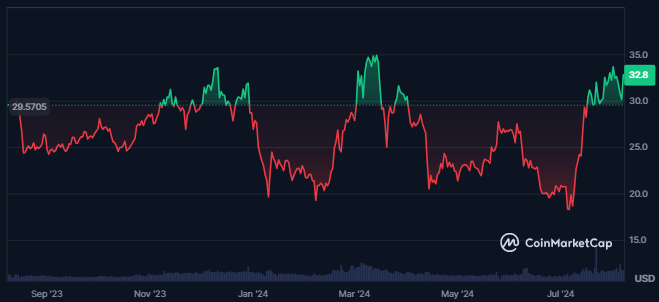
The token’s market cap dominance was 0.03%, followed by a market cap value of $535.816 Million. This further made it the 99th largest cryptocurrency in the global crypto market.
In the last 30 days, the token price traded in green for 17 days. The crypto has very good liquidity, followed by a volume/market cap ratio of 15.89%. This resulted in a traded value of $84.315 Million, which further led to a decline of 21%.
The token’s circulating supply was 16.328 Million ZEC. Its maximum supply is similar to Bitcoin’s maximum supply. Also, the token’s fully diluted market cap was worth $687.444 Million.
The price volatility of the Zcash token was very high at 11.92%. This indicates that uncertain fluctuations in the token price might be witnessed in the future.
The top 10 holders of Zcash have 14.81% of the maximum supply, which gives them a major chunk of power. Additionally, the number of token holders has stayed static over the last few months.
The largest holder of the token alone had 6.74% of the supply, resulting in a quantity of 1.414M ZEC.
Zcash Token Derivatives Data Analysis
The Zcash token’s derivatives traded volume declined by 41% in the last 24 hours from press time. This further resulted in a traded value of $66.26 Million, followed by a long/short ratio of 1.0276.
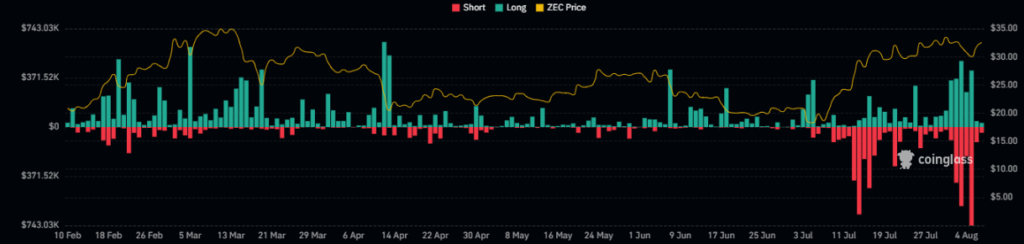
An advance of 14.9% in the open interest of the Zcash token was recorded in the previous 24 hours. This showed a rise in the derivatives open contract of the token.
Higher shorts were also liquidated in just the last 24 hours worth $116.56K, against which only $44.25K longs were liquidated. This showed the dominance of buyers in the token’s price.
ZEC Token Technical Analysis
ZEC has advanced by over 100% in less than 45 days. This showed strong dominance among buyers in the market.
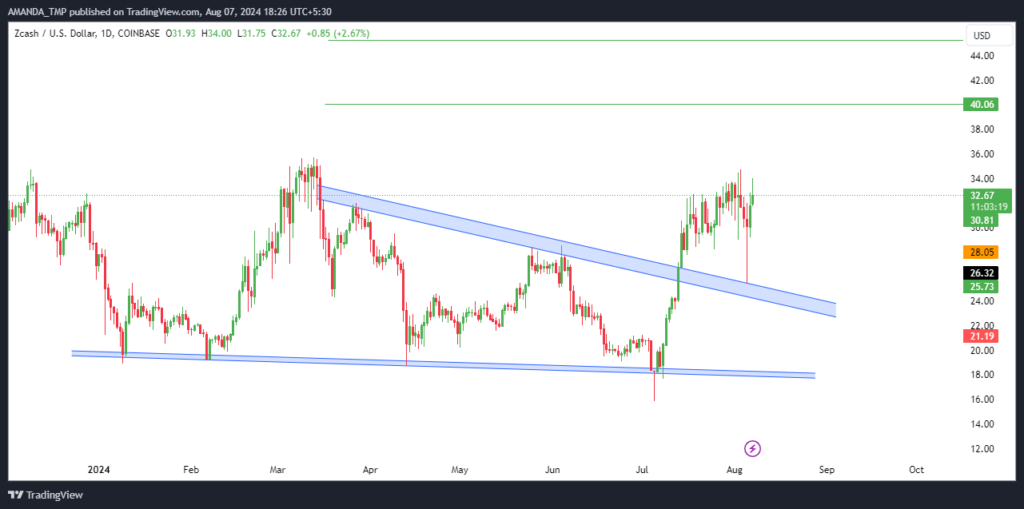
A falling wedge pattern was formed on the daily ZEC token chart, followed by a price decline for approximately 100 days. Following the recent price action, the token price broke out above the pattern on the 14th of July 2024.
Since the breakout, the token price has sustained the breakout levels. It showed a higher probability of a further surge in the token price.
Zcash Token Technical Indicators Analysis
The 50-day and the 200-day EMAs have traded in a golden cross. The token’s price further received support from both the EMAs and advanced to higher levels.
ZEC/USD Chart by TradingView
The MACD and the signal line have traded in a bullish trajectory for a long time. This exhibited the token’s overall bullish trend.
RSI also traded close to overbought zones and hit the same a few days ago. It further followed a bullish cycle and traded at a level of 60.7.
Disclaimer
This article is for informational purposes only and does not provide any financial, investment, or other advice. The author or any people mentioned in this article are not responsible for any financial loss that may occur from investing in or trading. Please do your research before making any financial decisions.




