
 Pearl
Pearl Ondo
Ondo Ethereum
 Bitway
 Derive
 Pudgy Penguins
 NEAR Protocol
- Dogwifhat price rallied 16% in a week and gained significant traction.
- A rounding bottom pattern was exhibited on the daily chart, suggesting a rally is imminent.
Dogwifhat (WIF) price has increased by over 17% in the last seven days, raising the question of whether it can climb even higher.
It is likely going to recover recent losses, starting with a weekly rally over 17%.
It has recently rebounded from the 50 day EMA support zone and broke free from a period of consolidation. This sparked hopes that it could revisit the $5 mark in the coming days.
At press time, WIF price traded at $3.72, noting an intraday rise of over 2.10%. Its market cap rose to $3.72 Billion, ranked 45th among the top crypto coins.
Analysts See Bullish Potential: Here’s What Could Drive a Surge
Crypto Jack tweeted that WIF’s chart structure conveys a message that it could explode in the upcoming sessions. It was edging closer to breaking the falling trendline and is about to revisit its previous ATH in the coming days.
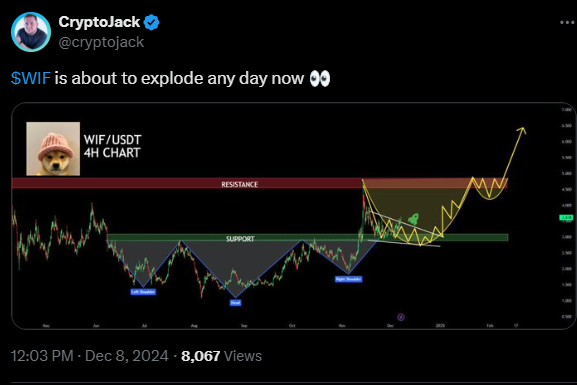
The picture for Dogwifhat price at the end of November was not quite rosy but the last few days saw a trend reversal. This was due to the rising participation of Dogwifhat holders.
This was evident from the daily active addresses which have risen by over 12% in the last 48 hours.
Dogwifhat Price Prediction: Key Indicators Explained
WIF’s weekly timeframe analysis depicts a bullish bias, as it records a close above the previous two weekly candlestick price $3.70. The price action conveys a sign of accumulation as trading volume surged steadily.
Typically, when the asset’s price surges in tandem with volume, it gives a strong bullish conviction that participants are confident.
Moreover, WIF’s Balance of Power (BOP) which measures the strength of buyers versus sellers, is showing bullish bias. At press time, WIF’s BOP is 0.27, suggesting buyers’ dominance and could fuel price higher.
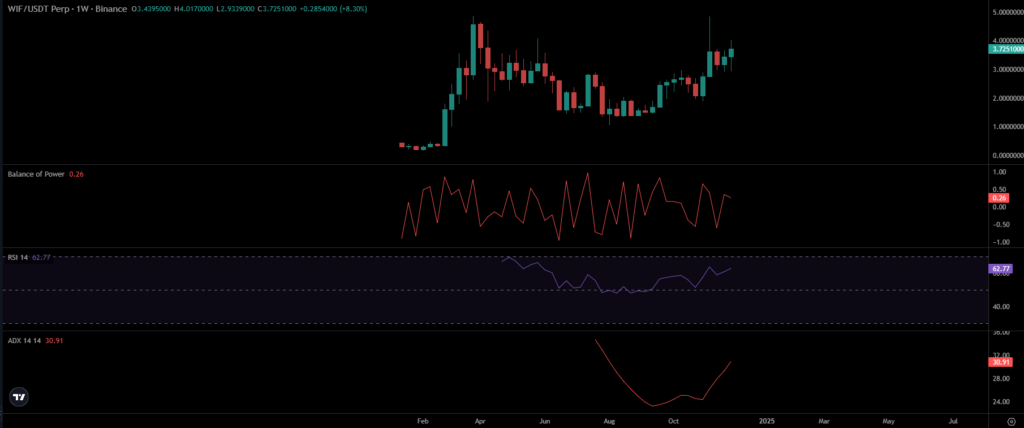
Also, WIF’s Relative Strength Index (RSI) had a reading of 62, showing an upward trend. A positive crossover was exhibited, implying bullish momentum on the chart.
The Average Directional Index (ADX) was approaching the 30 mark, confirming the strength of the uptrend. Generally, readings above 30 signify that buyers are in control.
WIF’s price rally appears promising with rising daily active addresses, growing volume, and a favorable price chart structure.
Per the Fibonacci retracement levels, the memecoin stayed above the 61.8% and aimed for a breach of the 78.6% zone.
What Does Futures Market Data Say?
According to Coinglass’s liquidation data, WIF seemed to have a bullish bias, with clusters of liquidation pools above its retested support level.
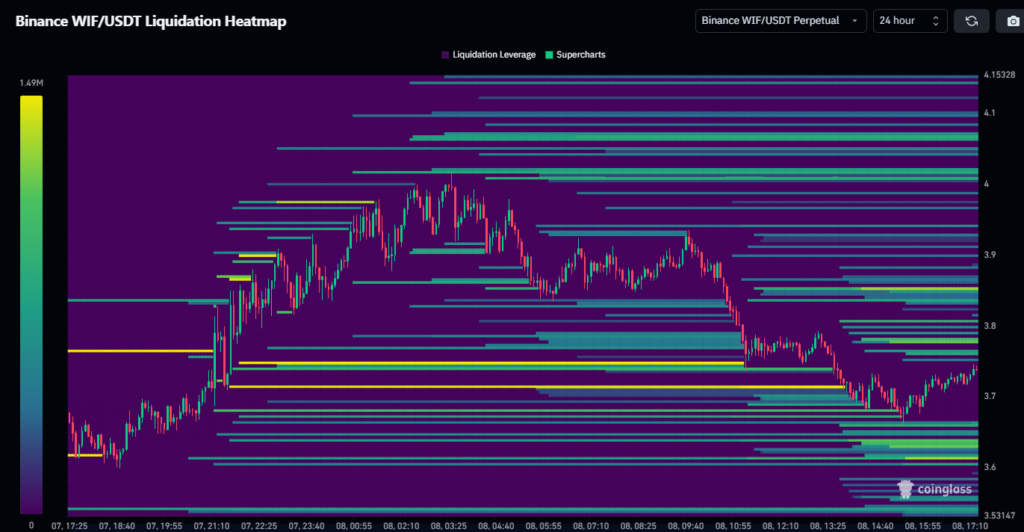
These areas serve as critical thresholds and could trigger a buy-side liquidation which may result in a follow-on price rally ahead.
Moreover, the OI-weighted funding rate stayed positive at 0.0450% conveying steady demand for the long contracts.
The immediate support zones were $3.60 and $3.45, whereas the upside hurdles were $4 and $4.30.
Disclaimer
This article is for informational purposes only. This analysis should not be considered financial advice. Crypto investment involves inherent risks due to the volatility in price. Readers should conduct their own research before making any investment decision. Also, you can consult a crypto expert before investing in cryptocurrencies.




