
 Puffer
 Bitcoin
 ZKsync
 NEAR Protocol
 Walrus
 Pearl
Pearl Ondo
Ondo
- Ethereum price has shown weakness in the supply zone.
- The 24-hour trading volume has dropped to 28.95% to $590.15 Million.
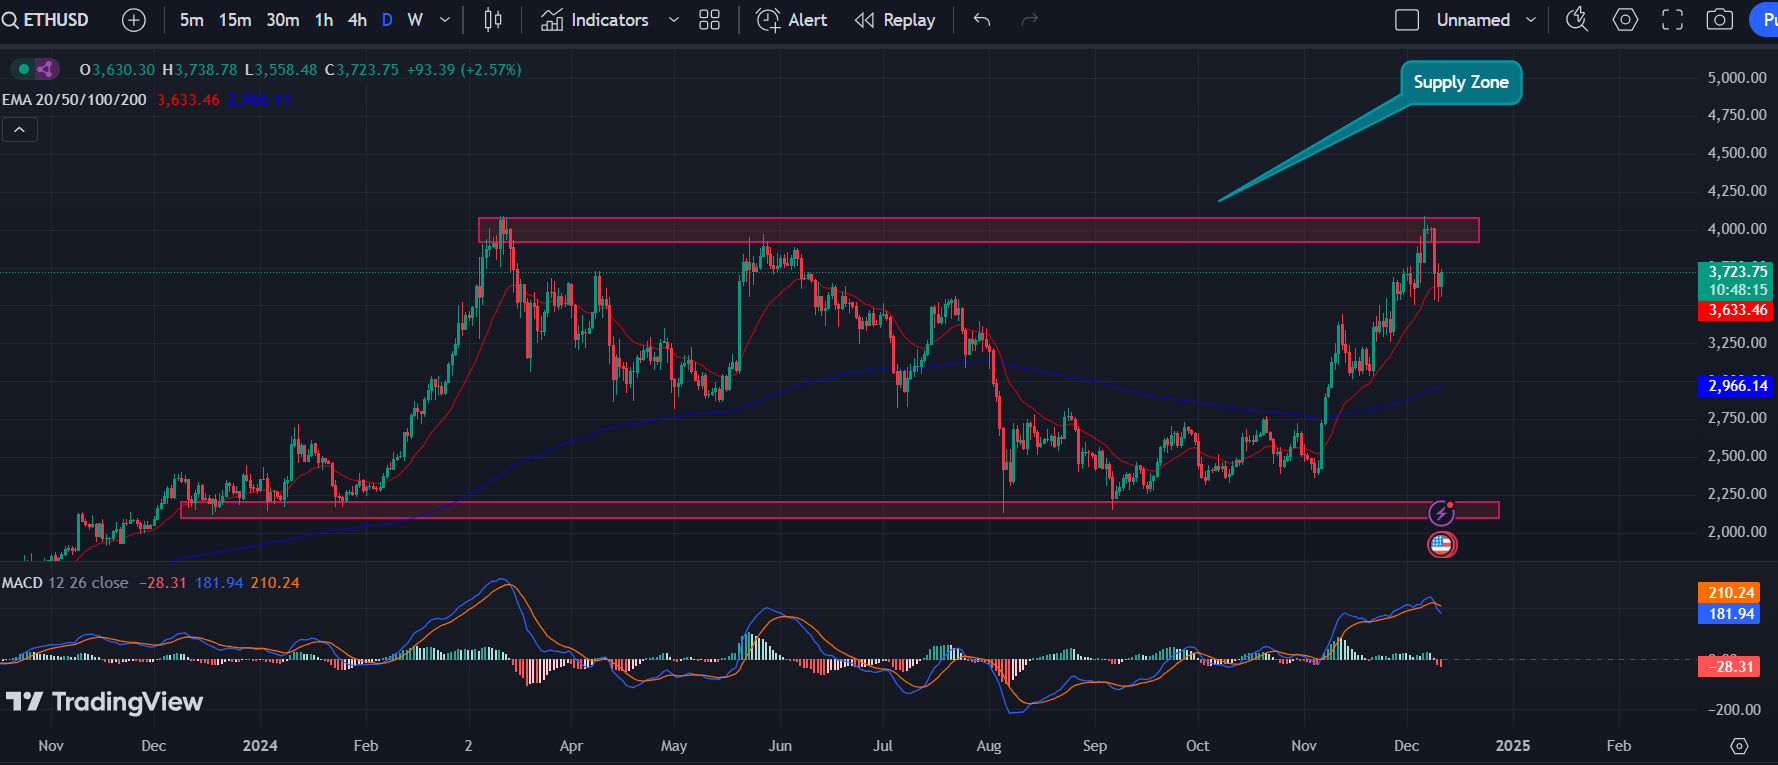
Ethereum (ETH) price has experienced mild selling pressure in the supply zone on a wider time frame. ETH price has declined by 11% in the past two days but has managed to defend the 20-day EMA. It has formed a bullish engulfing candlestick in the pullback territory which could attract buyers.
Throughout 2024, this Ethereum chart shows daily percentage changes in addition to ETH price fluctuations. The purple line on the graph represents the price of Ethereum in USD, while the red and green areas represent the daily percentage changes.
Ethereum saw notable volatility throughout the year, with both positive and negative daily changes spiking sharply. Notably, there has been more positive momentum in recent weeks, indicating that traders are more active and optimistic.
Since November, the price has been bullish and is facing resistance from the major resistance level of $4K. However, it has declined slightly and has triggered a pullback. Let’s see how the Ethereum price reacts near the resistance zone.
Ethereum ETF Flow Analysis
Significant inflows and outflows over the past few months are highlighted in the chart, which shows the historical netflow trend for different Ethereum ETFs (ETHA, ETHE, etc.). Significant buying pressure is indicated by abrupt increases in inflows.
On November 11, 2024, there was a notable inflow of $1,100 Million, followed later in the month by other noteworthy sums of $754 Million and $883 Million.
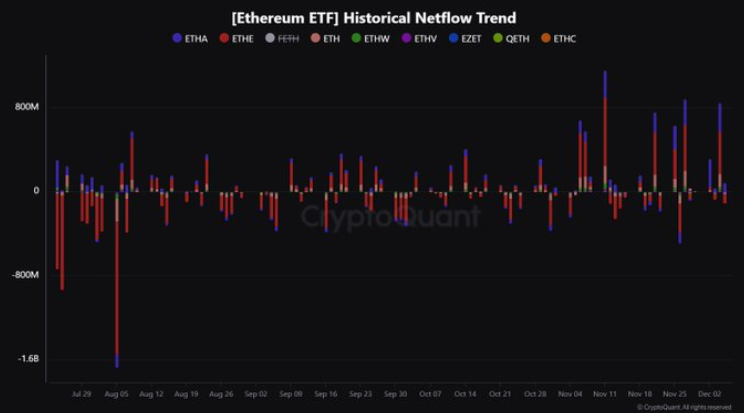
These sizable inflows point to significant capital entry points into the Ethereum market and heightened investor confidence. In line with general market trends and investor sentiment, this activity highlights Ethereum’s increasing interest and potentially bullish outlook.
These movements frequently indicate a favorable response from the market and may portend a promising future course for Ethereum prices.
Technical Analysis of Ethereum Price Over 1-D Timeframe
At press time, Ethereum crypto was trading at $3,729.00 which has climbed by 2.77% over the past 24 hours. The market capitalization was $449.54 Billion and the 24-hour trading volume was $49.21 Billion.
The graph highlights a clear trend: Ethereum usually peaks later than Bitcoin and grows by a larger percentage.
This delay and elevated peak might indicate that Ethereum’s investor sentiment dynamics and market reaction time differ from Bitcoin’s.
Ethereum is performing noticeably worse than Bitcoin in the current cycle. This points to a possible change in investor preferences or market dynamics, where the elements that contributed to Ethereum’s prior superior performance might not have as much of an impact.
Since this change may affect future trading and investment strategies, investors must understand the intricacies of cryptocurrency market cycles.
This Ethereum chart highlights noteworthy patterns in market behavior by following the price movement and Net Taker Volume over an extended preiod. With the price on the right y-axis and the volumes in millions, the graph shows the price of Ethereum (in blue) overlaid on both positive (green) and negative (red) net taker volumes.
Disclaimer
This article is for informational purposes only and provides no financial, investment, or other advice. The author or any people mentioned in this article are not responsible for any financial loss that may occur from investing in or trading. Please do your research before making any financial decisions.




