
 Dacity Coin
 Bitcoin
 Pearl
Pearl NEAR Protocol
 Quantus
 Bittensor
 Pudgy Penguins
- Polkadot appears to be bullish and poised for a massive rally.
- Spot flows bounce back into the positive side of things albeit slightly
After a significant decline mid-week, Polkadot’s native token DOT bounced back from the 20-day EMA mark as bulls regained traction.
Last week, DOT price reached $11.34, reflecting profit booking, and retested the 50% Fibonacci zone.
However, the bulls reshaped their muscles and eyes for a significant bounce. Like major cryptocurrencies, DOT daily chart presented bullish price action, suggesting a perfect buying opportunity to chase the uptrend.
At press time, DOT price traded at $9.09, noting a rise of over 5.34% in the last 24 hours. Its market cap rose to $13.89 Billion, ranked 15th among the top crypto coins.
DOT Price to $19: Analyst Weighs In
A recent tweet by @CryptoELITES highlighted that Polkadot crypto’s ascent has begun. It has broken the multi-month descending trendline with a substantial surge in trading volume.
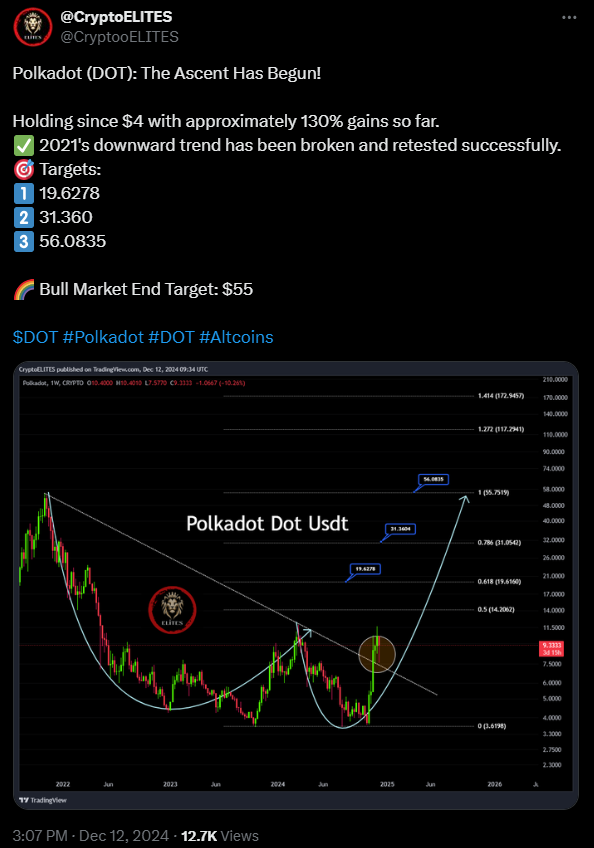
With the recent breakout, DOT crypto has entered into a bull market and is positioned for a significant upsurge. The short-term targets for DOT were $19.62 and $31.36, whereas the long term target were $55.
Polkadot Price Prediction: What to Expect Next?
Polkadot crypto has been flirting near the breakout zone and hovers near the critical $10 resistance zone. However, Polkadot price prediction remains bullish on the weekly timeframe as the rising EMA lines project bullish bias.
The Relative Strength Index (RSI) hovered around the neutral 50 mark, reflecting significant space for further upward movement without being overbought.
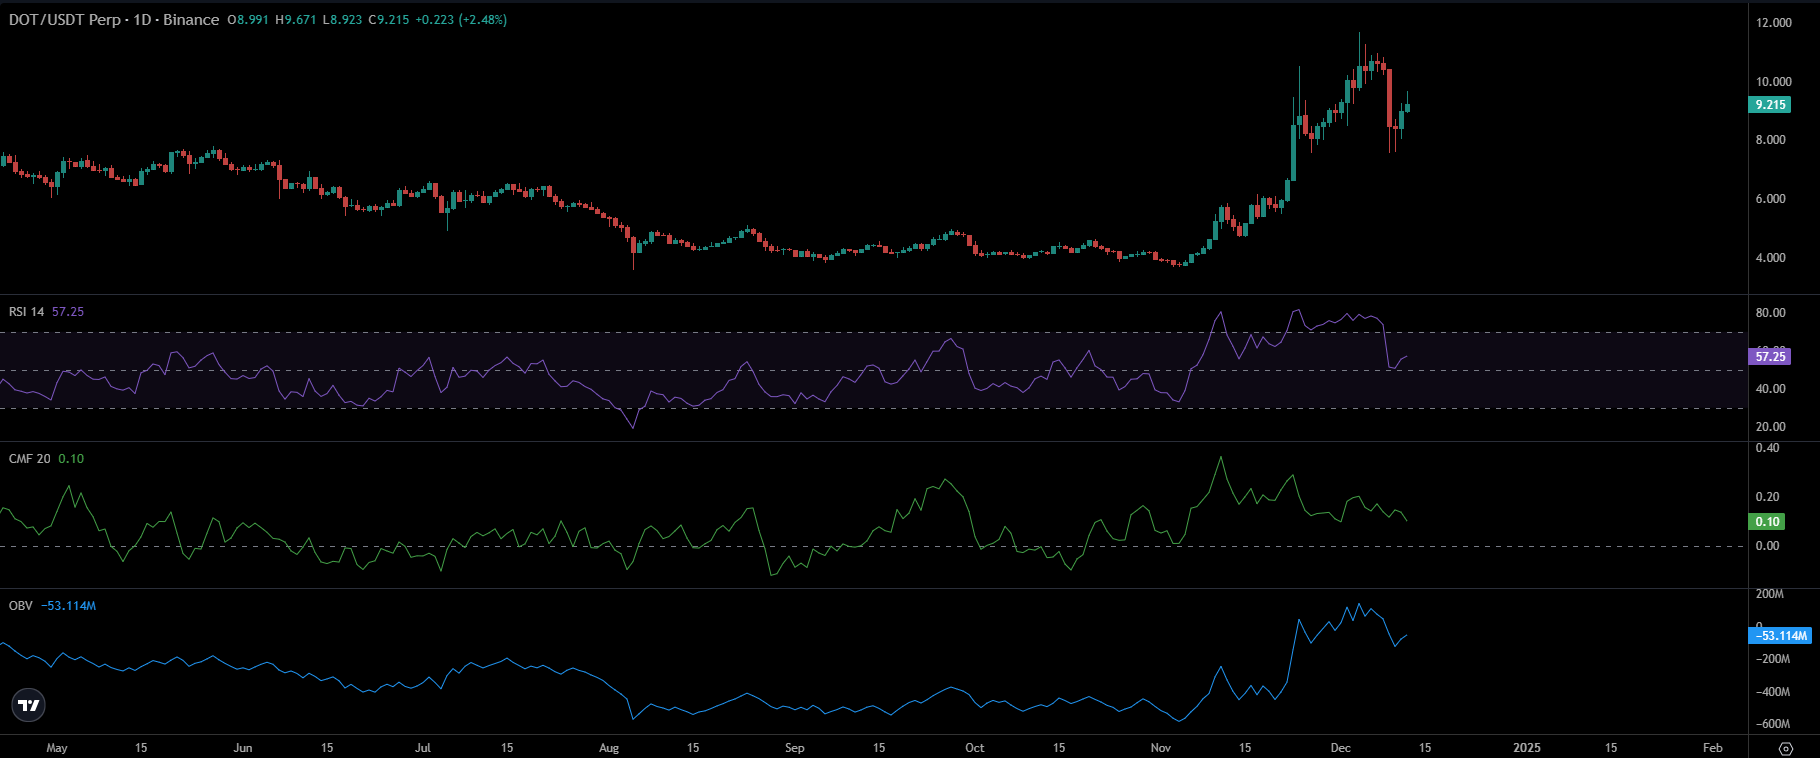
Moreover, the Chaikin Money Flow (CMF) had a reading of 0.10, pointing toward the rising capital inflows.
Also, the On-Balance Volume (OBV) displays a sustained rise, adding weight to the bullish thesis.
If the altcoin surpasses the $10 resistance level, a rise toward $19 could be anticipated in the short term.
What Does Derivatives Data Say?
Data from Coinglass shows that spot inflow/outflow of DOT peaked at $24.52 Million on December 9th, the highest outflows observed in 2024. Later, it cooled off in the last two sessions. It means that significant selling pressure was observed on the same day.
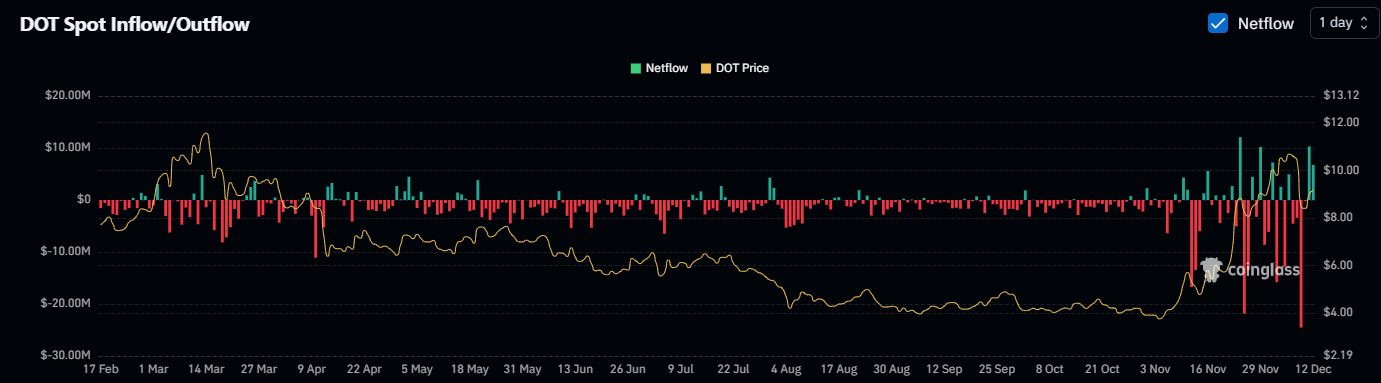
If the value is negative, reflecting increased outflows, suggesting that holders are unwilling to sell. This means DOT price might recover its recent 17% drop, and rally further.
Following this, DOT’s OI-weighted funding rate is positive, it represents that long-positioned traders are paying shorts to keep their position open or otherwise.
Thus, when this metric is positive, it indicates that buying pressure outweighs selling pressure. As a result, the positive funding rate means the sentiment among the participants might be buoyant with anticipation of a bounce-back.
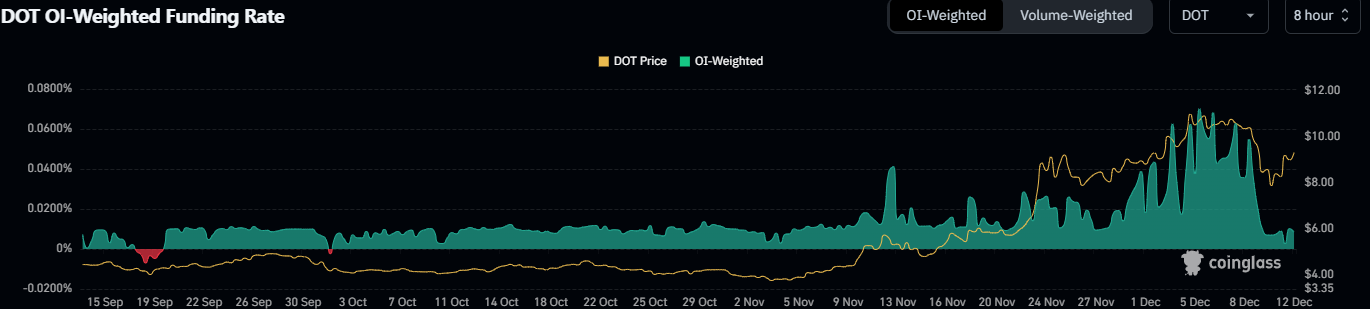
Over the past 24 hours, the Open Interest (OI) surged over 6.38% to $478.27 Million, signifying long buildup, representing a positive outlook.
If such outflows persist, it could fuel significant buying pressure and lift the price.
The immediate support zones for DOT were $8.80 and $7.60, whereas the resistance zones were $10 and $11.30.
Disclaimer
This article is for informational purposes only and provides no financial, investment, or other advice. The author or any people mentioned in this article are not responsible for any financial loss that may occur from investing in or trading. Please do your research before making any financial decisions.




