
 Zerebro
 Bitcoin
 Quantus
 Pearl
Pearl Starknet
 ZKsync
 NEAR Protocol
- ETH price has dropped by 19% in the past three weeks.
- Ethereum price has formed a bearish candlestick pattern on top.
Ethereum (ETH) price had witnessed a strong bullish trend in November and touched the $4K mark. Since then, buyers have attempted twice to overcome the $4K territory, but sellers proved too strong each time.
The price has formed a double-top pattern on the daily time frame and displayed a sharp fall. However, ETH has reversed from the support zone of $3K and has exceeded the 20-day EMA.
Recently, the price dived below the 20-day EMA and reached close to the 200-day EMA. On the daily time frame, the price has formed a head & shoulder pattern which might attract sellers.
As market watchers look on at a disappointing ETH chart, concerns about a possible market sell-off have been raised by Fidelity’s recent large transfer of Ethereum to Coinbase.
Fidelity made 31,249 ETH deposits totaling $103.55 Million through Cumberland yesterday, including an 11,250 ETH deposit of $36.9 Million in the last 20 minutes.
Institutional Deposits Noticed: What Next for ETH Price?
An increase in institutional deposits on exchanges like Coinbase frequently results in a greater supply of market assets and may indicate that selling pressure may be imminent.

Large transfers from institutions in particular cause the market to anticipate more selling pressure, which lowers prices. These concerns are only heightened by Fidelity’s recent actions, as the market appears to be in a vulnerable state.
An increase in Coinbase trading activity may be linked to the Ethereum inflow, suggesting that institutions are either planning to sell their holdings or engage in significant transactions. Prices are likely to experience additional downward pressure when supply increases in the exchanges without corresponding demand.
ETH Price Shaped a Head & Shoulder Pattern
Ethereum crypto was trading at $3,305.00 at press time, up by 2.64% over the past 24 hours. The market capitalization was $398.22 Billion and the 24-hour trading volume was $28.33 Billion.
ETH price has formed a bearish candlestick pattern named head & should pattern. However, the right shoulder is yet to form. The right shoulder of course, would preceed a bearish trend.
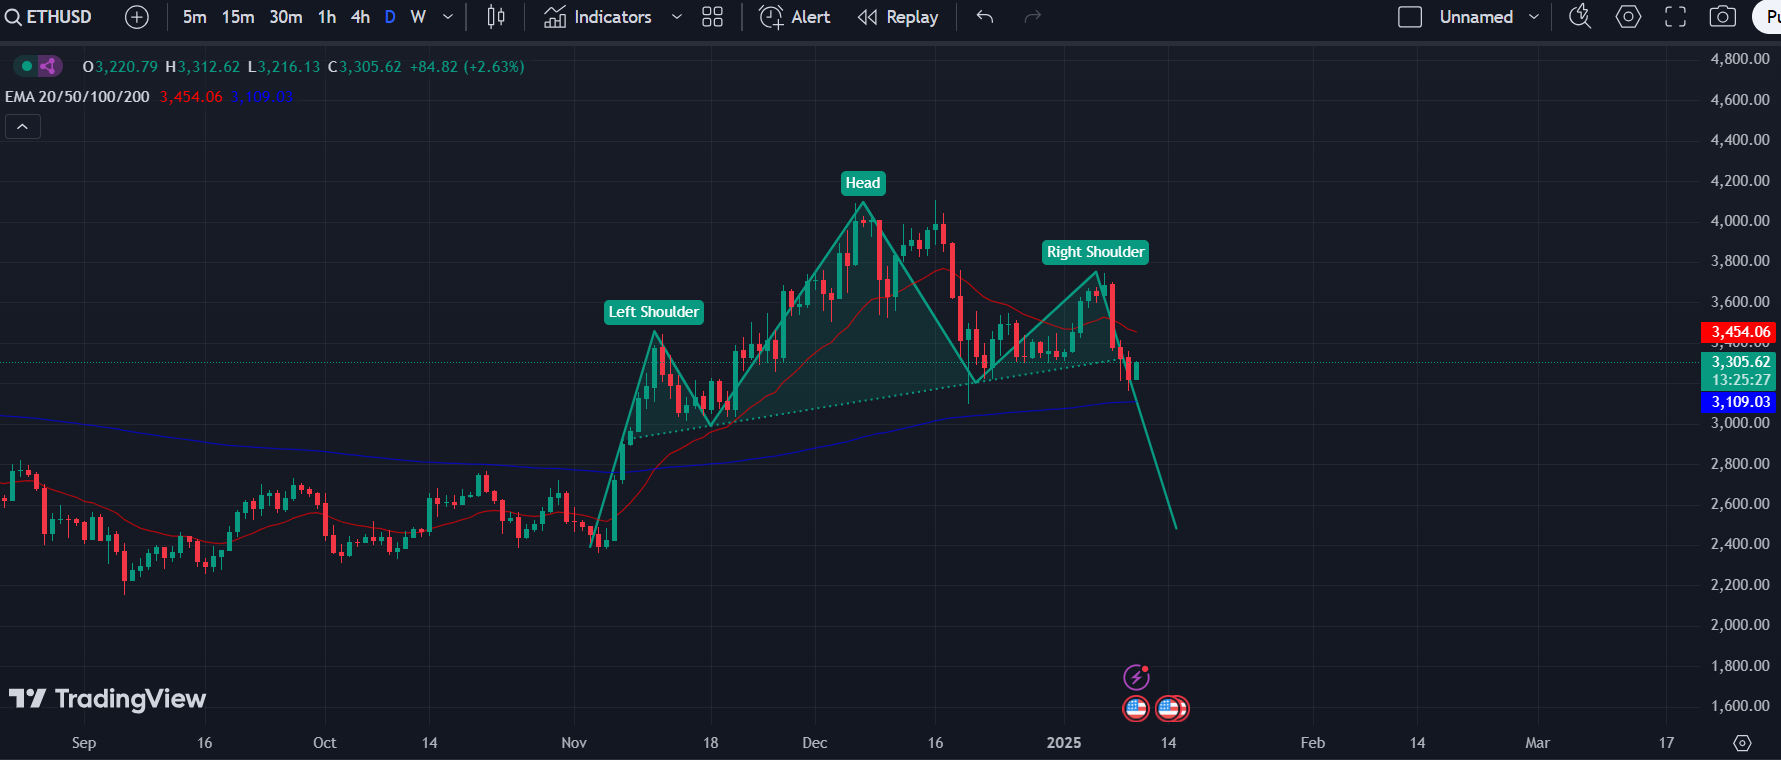
Based on the technical chart, the Ethereum price is about to lose the support level of $3.3K. If the price holds below the 200-day EMA, strong selling pressure can be anticipated. If sellers remain strong, the price might melt to the major support level of $2K amid this cycle.
Alternatively, if the price takes support on the 200-day EMA, it could be a buying opportunity. if the price forms any bullish candlestick pattern, it may gain bullish momentum. Once the price exceeds the 20-day EMA, a decent bullish rally can be observed.
Ethereum Price Analysis Amid Whale Activity
Recent activity surrounding Ethereum, particularly Fidelity’s substantial deposit of 31,249 ETH on Coinbase, raises concerns about potential sell-off pressures in the market. With the price dropping 19% over the past three weeks and forming bearish patterns such as a head & shoulder formation, the outlook appears precarious.
While ETH has shown resilience by bouncing off the $3K support, it is struggling below the 20-day EMA the 200-day EMA. Therefore, continued pressure from sellers could lead to further declines, potentially targeting the critical support level of $2K.
However, if the price manages to hold above the 200-day EMA and forms bullish patterns, there may be a chance for a recovery and renewed buying interest.
Disclaimer
This article is for informational purposes only and provides no financial, investment, or other advice. The author or any people mentioned in this article are not responsible for any financial loss that may occur from investing in or trading. Please do your research before making any financial decisions.




