
 Minter
 Sui
Sui Pons
Pons NEAR Protocol
 Starknet
 Quack AI
 Chainlink
- Solana price has escalated by 20% in less than four days.
- SOL price has triggered a breakout from a descending trendline.
Solana (SOL) price has been in a bullish trend since September and has gained around 66%. However, the bullish rally was interrupted near the $265 mark and underwent a correction phase. During the correction phase, the price dropped to the 200-day EMA but failed to dive below. Solana price has managed to defend the 200-day EMA twice since December.
Recently, the SOL price took support on the 200-day EMA and surged by 20% in the four days. Amid this bull run, the price had surpassed the 20-day EMA and broke out from a descending trendline.
Trump-related cryptocurrency speculation has increased interest in Solana’s recent price spike. This move fits in with the general optimism that is propelling the cryptocurrency market higher right now.
Solana Price Analysis Based on Technical Indicators
The TD Sequential indicator gave a bullish signal supporting Solana’s current performance. According to this trading tool for volatility forecasting, Solana is about to experience another surge.
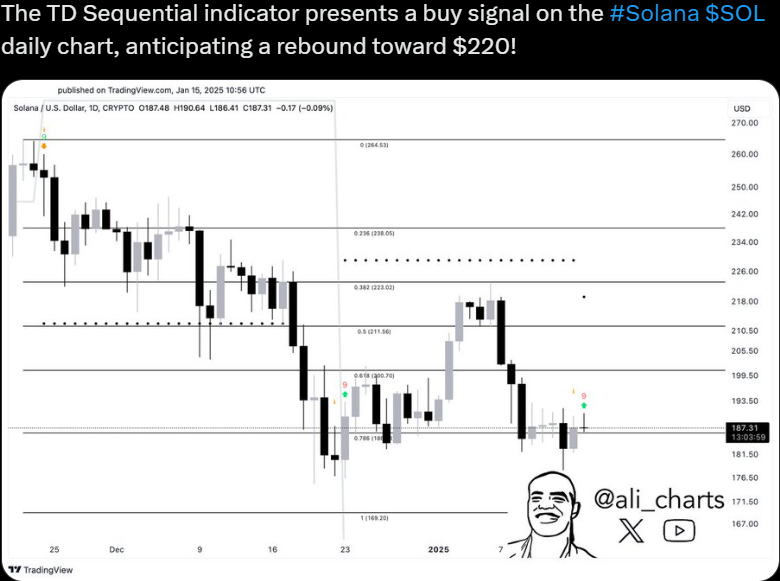
The state of the market at the moment indicates that market players are interested in Solana price levels close to important resistance.
Solana Beats Ethereum in Terms of DEX Volume
Furthermore, compared to Ethereum, Solana has a larger volume of trading on decentralized exchanges (DEX). As a result, this development highlights the blockchain platform’s scalability and efficiency, which will appeal to both users and developers. The network has also gained popularity in the cryptocurrency market due to its low cost and quick transaction throughput.
Institutional and retail investment in Solana may therefore continue to increase because of this trend.
Solana Price Overview & Technical Analysis
Solana crypto was trading at $219.66 at press time with an intraday gain of 4.04%. The market capitalization was $106.95 Billion and the 24-hour trading volume was $5.64 Billion.
Based on the chart, the price has departed from the correction phase and broke out from the trendline. If SOL price manages to sustain over the trendline, buyers may eye the $300 mark.
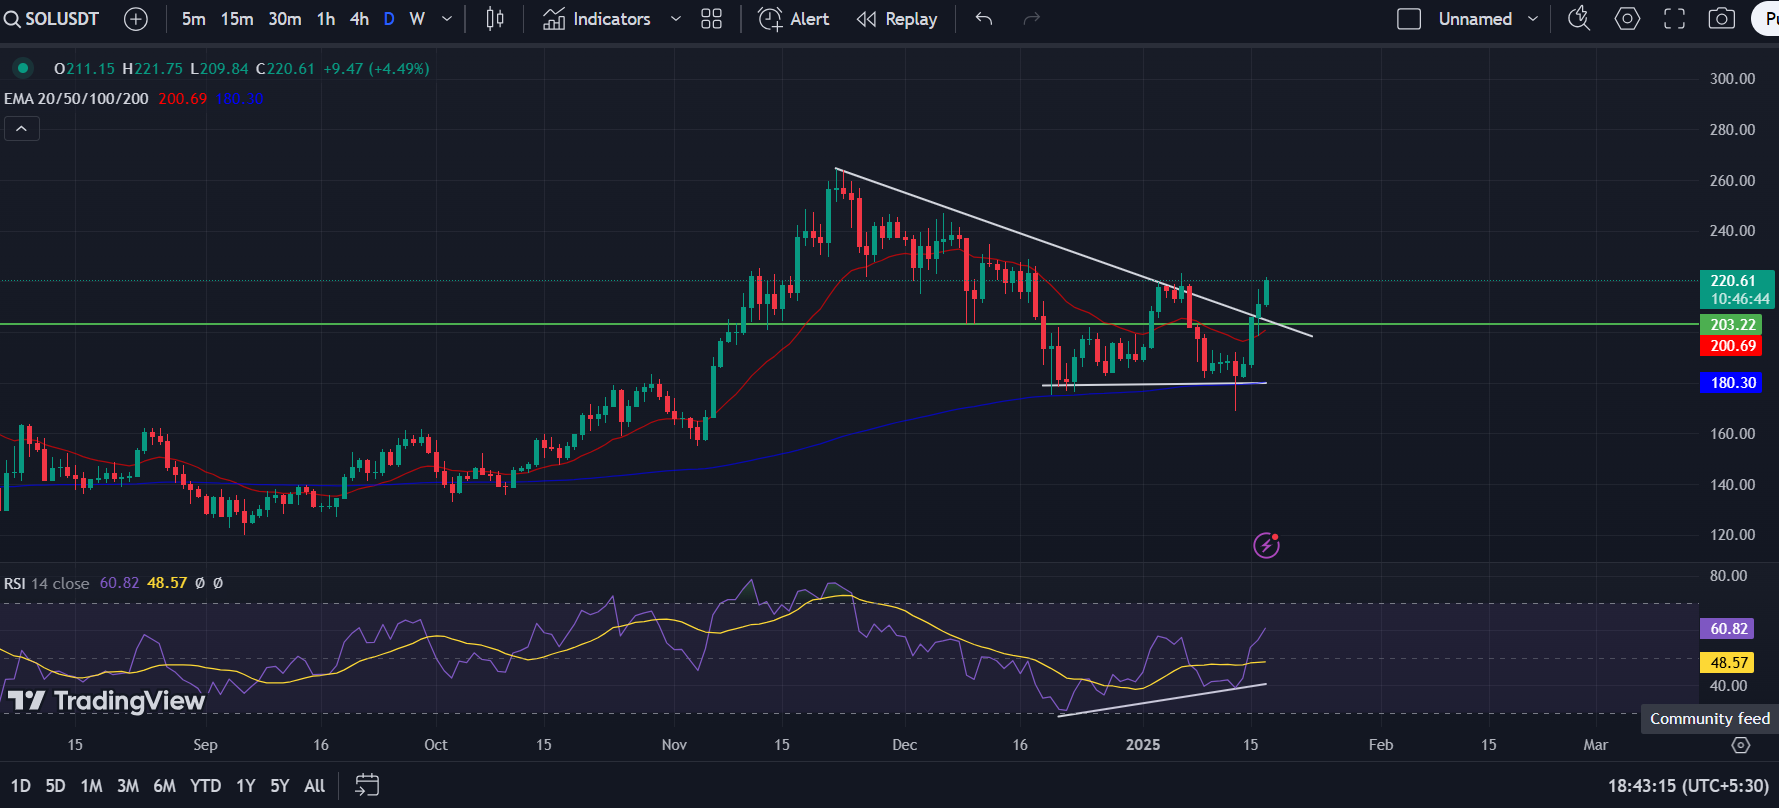
On the other hand, if the price forms any bearish candlestick pattern in this territory, it may continue its recent momentum. The recent trend was bearish amid seller dominance. Once the price slips below the $180 mark, strong selling pressure can be anticipated. RSI has triggered a bullish divergence which indicates a bullish forecast.
Solana Price Analysis Post Breakout
Solana’s recent price movement indicates a significant bullish trend, characterized by a 20% increase within a short period and the successful defense of the 200-day EMA.
The breakout from the descending trendline and positive signals from technical indicators like the TD Sequential suggest there is potential for further gains. In the same view, the $300 mark wouldn’t be far.
The growing interest in Solana, driven by its performance on decentralized exchanges and the overall optimism in the cryptocurrency market, positions it as a strong competitor against Ethereum.
However, vigilance is necessary, as any bearish patterns could lead to a downturn, especially if the price falls below the $180 mark.
Disclaimer
This article is for informational purposes only and provides no financial, investment, or other advice. The author or any people mentioned in this article are not responsible for any financial loss that may occur from investing in or trading. Please do your research before making any financial decisions.




