
 Minter
 Quack AI
 NEAR Protocol
 Sui
Sui Hyperliquid
 Cardano
 Raydium
- DOGE trading volume has surged by 100% to $11.15 Billion.
- Dogecoin price has witnessed mild correction from the key resistance level.
Dogecoin (DOGE) price has received continuous buying pressure since mid-December. The price has been rising by defending an ascending trendline. The Dogecoin price has recently faced resistance from the previous resistance zone and has declined drastically. Amid this fall, the price has dropped to the ascending trendline. However, buyers have shown interest and have managed to defend the trendline.
TD Sequential Indicator Analysis
The TD Sequential indicator has issued a sell signal on Dogecoin’s 12-hour chart. This indicator is well-liked by traders because it suggests that a trend may be reversing. The upward trend has reversed, as indicated by the emergence of a ‘9’ sell signal.
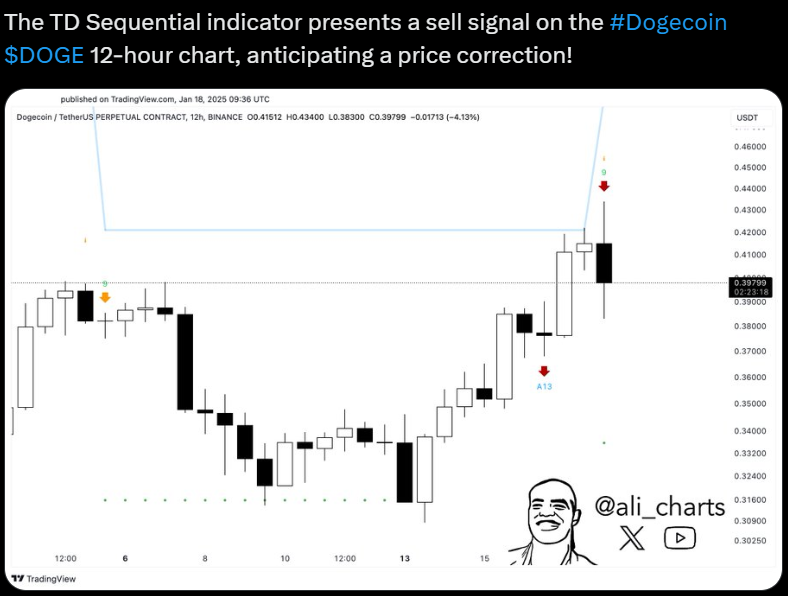
In addition to this signal, the price of Dogecoin has not been able to overcome the resistance level of $0.44 based on recent price movements. This outlook is consistent with the indicator’s prediction of a likely price correction.
Traders may be anticipating a shift in the trend since these signals are suggestive of an accumulation of selling pressure.
DOGE Price Has Formed an Ascending Triangle Triangle: What’s Next?
When writing, Dogecoin crypto was trading at $0.381 which has surged by 6.47% over the past 24 hours. The market capitalization was $56.21 Billion and ranks 7th in the cryptocurrency market.
Based on the technical chart, the price has been struggling in a horizontal line and an ascending trendline. The overall trend is bullish and the price is also moving toward the horizontal line.
The current crypto market sentiment is bullish which might leave a positive impact on the Dogecoin price momentum.
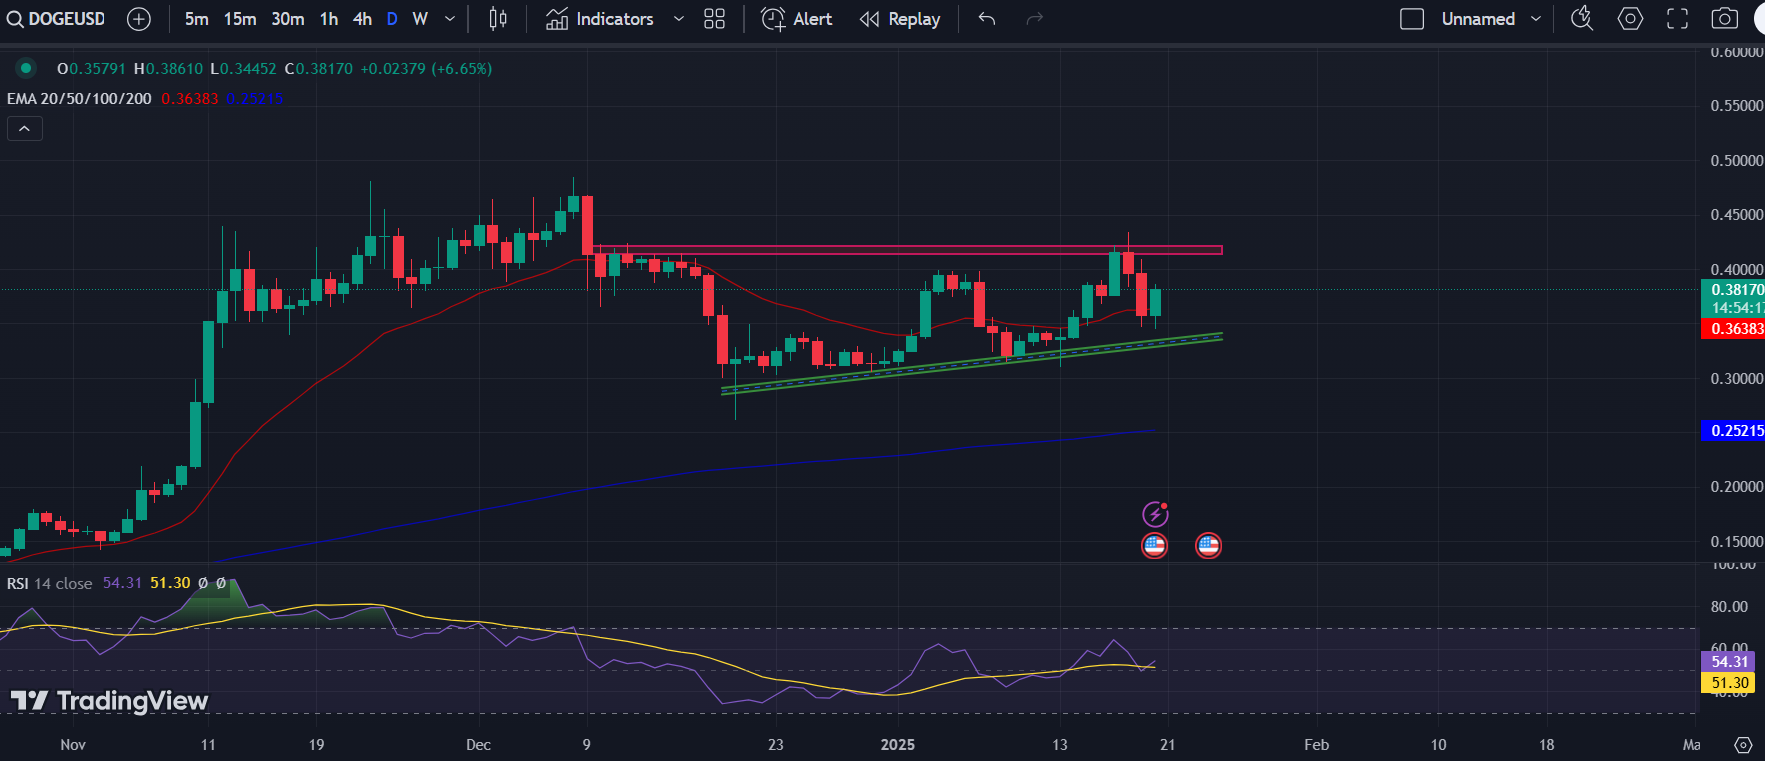
If the price triggers a breakout from the triangle, it would be a bullish signal. If the price manages to sustain over the $0.41 mark, buying momentum can be anticipated.
Suppose the price exceeds the previous swing high, another bullish rally can be observed.
Conversely, if the price slips below the 20-day EMA, selling pressure can be seen. If the price holds below the ascending trendline, strong selling pressure can be seen.
Here, most trades and investors might prefer to book profit which may result in a strong bearish trend.
Turning to the technical indicators, the DOGE price has smashed the key moving averages which showcases the bulls’ strength. RSI has bounced back from the RSI-based moving average which indicates the bullish forecast.
Dogecoin Price Overview
Dogecoin is currently navigating a critical phase characterized by increased buying pressure and significant resistance levels. Meanwhile, the price has shown resilience by defending the ascending trendline. Technical indicators like the TD Sequential suggest a potential reversal, indicating that traders should remain cautious.
With the price trading at $0.381 and market sentiment leaning bullish, a breakout could signal further upward momentum.
However, if it fails to hold above key support levels, particularly the 20-day EMA, we could see heightened selling pressure and a shift toward a bearish trend. Overall, traders need to stay vigilant and adapt to market movements as Dogecoin continues to display mixed signals.
Disclaimer
This article is for informational purposes only and provides no financial, investment, or other advice. The author or any people mentioned in this article are not responsible for any financial loss that may occur from investing in or trading. Please do your research before making any financial decisions.




