
 Pearl
Pearl Walrus
 Starknet
 Quantus
 Bitway
 Sui
Sui Zylo Ecosystem

- PEPE follows Elliott Wave patterns, signaling a potential bullish rally.
- Liquidations hit $4.32M as short positions dominate market sentiment.
- PEPE consolidates near support with eyes on a $0.000017 breakout.
PEPE hints at a bullish surge with Elliott Wave patterns aligning and liquidations hitting $4.32M. Short positions dominate sentiment, but key support near $0.000015 and resistance at $0.000002162 could define the next market move.
PEPE Signals Elliott Wave Pattern Amid Consolidation
Elliott Wave theory applies to the PEPE market because current early-wave signals demonstrate previous price movement patterns.
The 2023-2024 movement demonstrated an entire five-wave sequential development where each specific wave maintained its special function. New rising indicators suggest that PEPE will follow a comparable price movement pattern during 2024-2025.
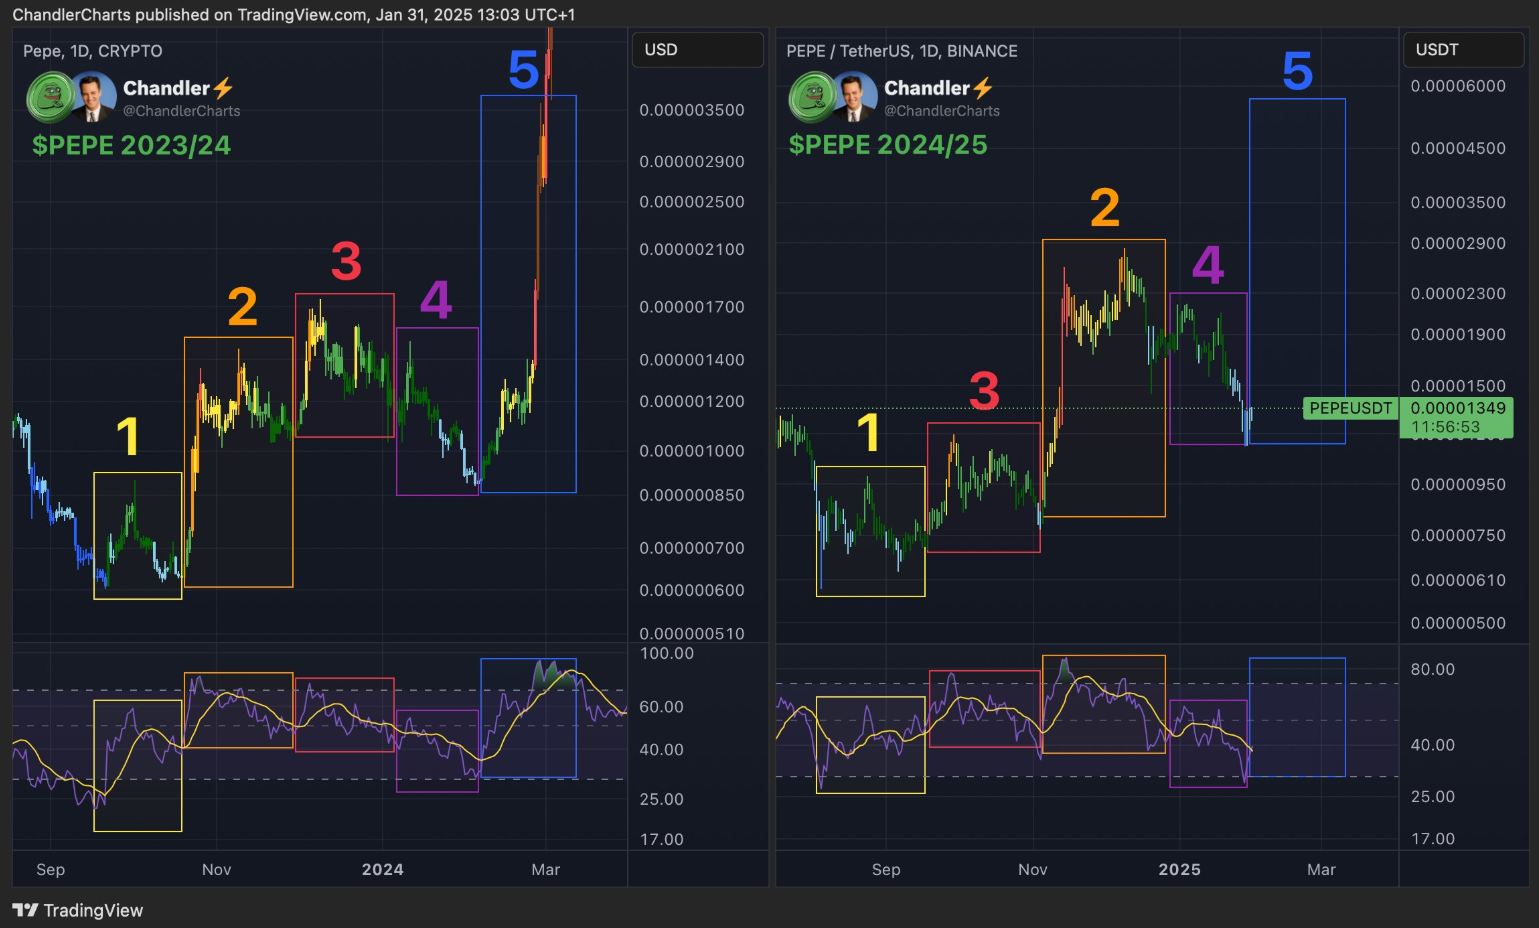
During the 2023 price surge, known as Wave 1, the market established favorable conditions for the robust price movement in the earlier phase of the cycle.
After Wave 1, the market entered into Wave 2, which functioned as the stabilization phase. Wave 3 demonstrated the highest momentum out of all waves. Yet, Wave 4 displayed a period of price stabilization before Wave 5 completed the cycle.
During the present 2024/2025 cycle, Wave 2 maintains its position at the 0.000015 support level, where another powerful price rally may occur.
Future price surges for PEPE may reach 0.00006 if a market breakout takes place. The technical indicator RSI indicates that the PEPE token would initiate a bullish trend if market momentum shows signs of recovery.
Long and Short Liquidations Reflect Market Sentiment
Data from CoinGlass reveals contradictory feelings about PEPE because protective short positions account for most of the recorded loss amounts.
In the last 24 hours, the market experienced $4.32 million in liquidations that split between $3.07 million shorts and $1.25 million long positions. Despite upcoming market changes, The Market Periodic analysis shows that bearish investor positions dominate current market sentiment.
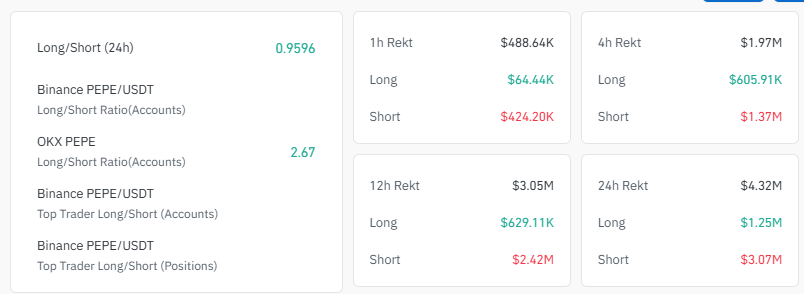
Additionally, short-term liquidations during the past hour became nearly $424,000 to demonstrate the leveraged traders’ risky strategies.
Binance traders protected their positions by keeping their short-term investments lower than their long-term investments with a ratio of 0.9596. OKX registered a bullish indicator through its 2.67 ratio, while traders on that platform remained optimistic.
The significant differences between active positions and trading liquidations provide clear indications about the level of market uncertainty.
The stabilization or upturn of PEPE prices might intensify price volatility through short squeezes. A sustained lack of market optimism would lead to an ongoing downward force on existing support zones.
Technical Analysis: PEPE Eyes a Breakout After Support Rebound
The token currently maintains a position at a vital support zone while preparing to break through this boundary. Current Supertrend signals remain uncertain because the indicator points towards a vital resistance at $0.00002162.
A confirmation is necessary before concluding that a bullish reversal occurs based on the MACD histogram signals.
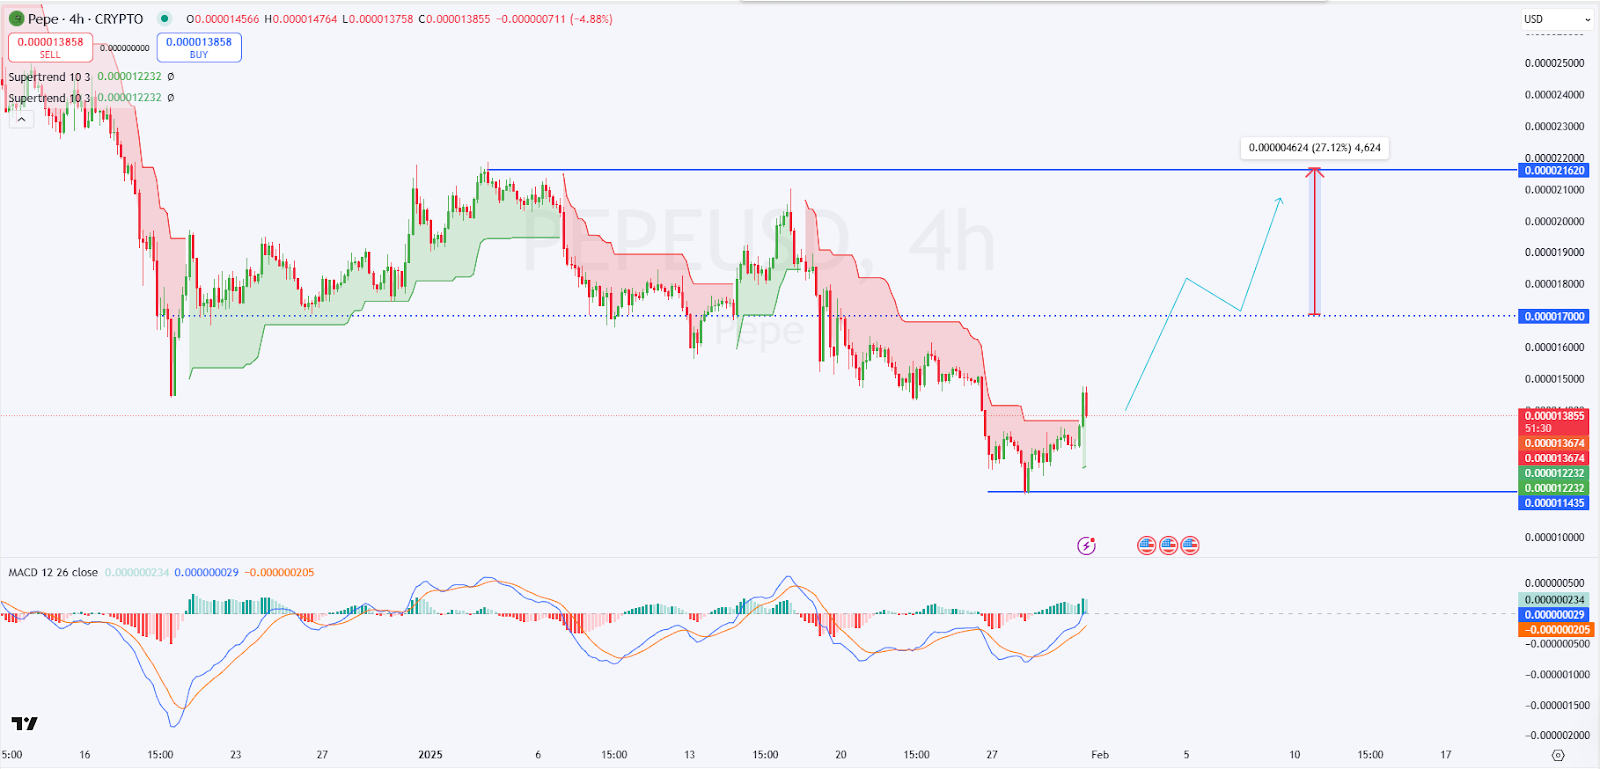
The Pepe price has recovered from its recent touch of $0.000011435 to show strengthening demand below these levels. A price increase above 0.000017 could fuel a 26% gain.
Market participants focus on essential psychological price marks because asset movements are intensifying near the present resistive zone.
The positive trends of momentum indicators such as MACD and RSI in the market confirm the potential for an upward price movement.
Disclaimer
In this article, the views, and opinions stated by the author, or any people named are for informational purposes only, and they don’t establish the investment, financial, or any other advice. Trading or investing in cryptocurrency assets comes with a risk of financial loss.




