Quack AI
 Lighter
 Pudgy Penguins
 Bittensor
 Solana
 Aptos
Aptos Quantus
- XRP currently struggles with bears with a decrement of 2.2% from yesterday’s price
- The token saw a drastic fall in its price after a steady climb, reducing the price by over 55%
- It is shuffling right between its 24-hour high-low price spectrum
XRP undergoes a bearish transformation after the recent fall in market price. It is trying its best to recover by breaking out from multiple positions, but to just keep going down. Although the current market price is above the price the token had before the breakthrough (purple rectangle), this does not promise a bullish climb. The market cap struggles to keep up by a mere increment of 0.36%. On the other hand, the trading volume of XRP of the past 24 hours lost over 36.42% of its value. It may lead to creating a supply zone sooner or later. The 7th ranked token with a market dominance of 1.99% registered a volume/market cap ratio of 0.05665.
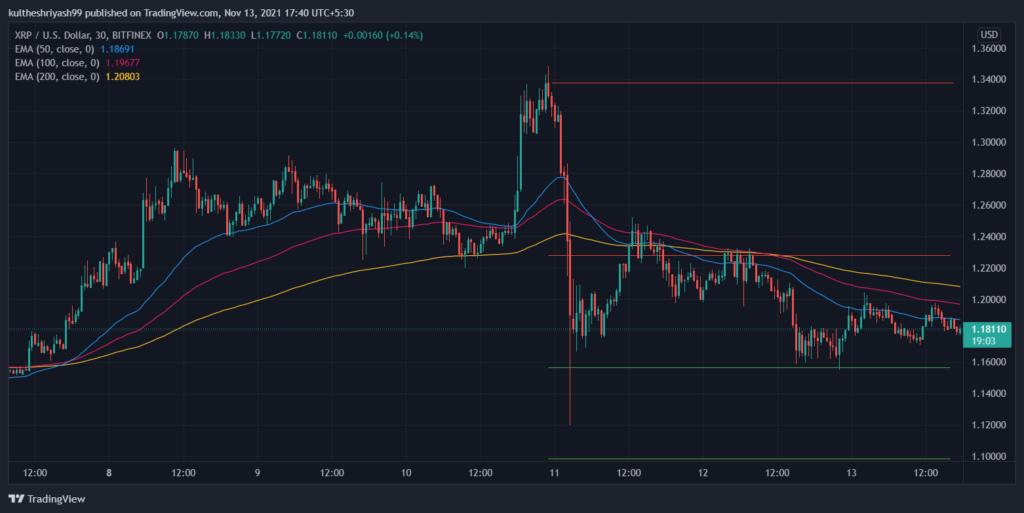
The chart above shows the market price candlesticks in a 30-minute time frame format. The token once traded above the major EMA lines before the fallout but went immensely deep below the lines after the market correction. There is no sign of a breakout if one considers the 200 EMA line for it. The 200 EMA is running up above the other lines and the market price. The 50 EMA line under the other lines indicates a short-term burial of a bullish trend. No reversal patterns or bullish patterns were spotted. It shows the possibility of the current bearish trend continuation.
Investors may consider buying XRP but should also consider the risks
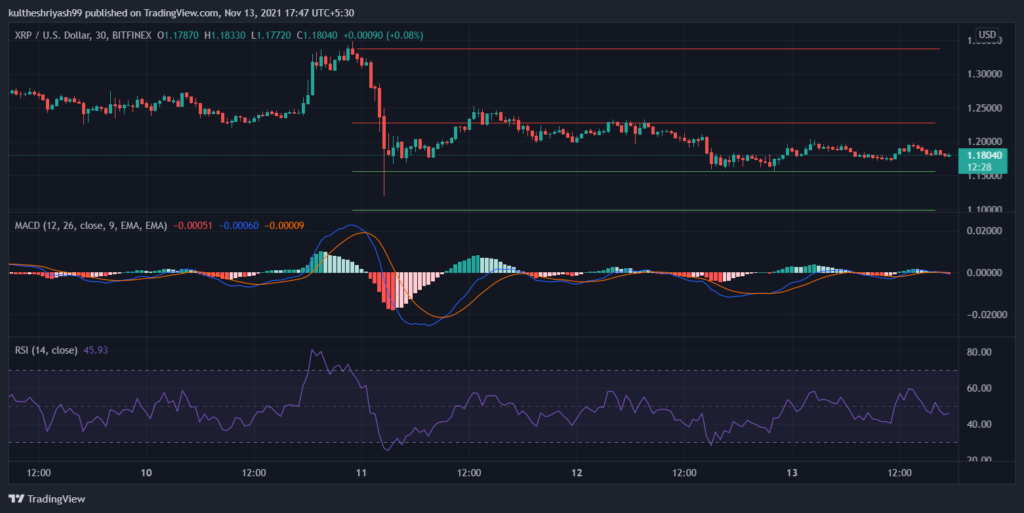
The MACD line is running very close to the zero level and just above the signal line. The above 4-hour time frame chart suggests that the token is going to rally between the first resistance and support lines for some time as it is way safer than going down more. The MACD suggests a buying period, but the uncertainty of an upcoming bullish trend is going to keep the investors in a dilemma. The RSI indicates a neutral zone and its value is staying just between the safe levels. It suggests a considerable holding zone.
Resistance is at $1.22 and $1.33, and the support levels are present at $1.09 and $1.15.
Conclusion- XRP is going to stay in the current trend for some more time. One can consider the MACD for buying but should also keep the risks coming with it in mind. Investors can also think of XRP as a long-term investment. However, every decision should be taken after thorough research and analysing the risks.