Dacity Coin
 Celestia
 Quantus
 Bitcoin
 Pearl
Pearl Pons
Pons Injective
- Litecoin price at the monthly chart is trading near the vital buyer’s zone, while the bulls are trying to regain the 20 and 50-DMA line short-term moving averages.
- The crypto asset is currently trading below its all vital moving averages of 20, 50, 100, and 200-day, whereas bulls struggle to regain the 20-SMA line.
- The pair of LTC/BTC is trading on a slightly negative note at 0.003092 BTC with an intraday drop of -3.18%, and the ratio of LTC/ETH is CMP at 0.03872 ETH with a 24-hour change of +0.80%.
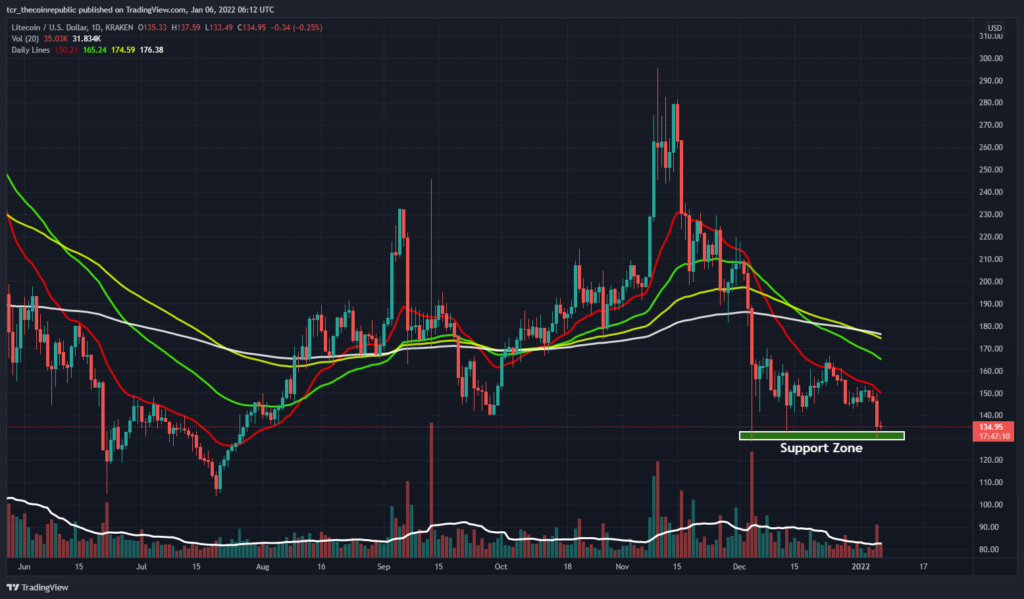
Litecoin price, after a roller coaster ride at the monthly time frame, is currently trading near the primary support zone. Presently, the coin is trading at the make or break zone at the monthly chart with slightly lower volume activity. Meanwhile, the coin is trying to get stable near the primary demand or support levels, and bulls may take charge if LTC manages to hold it. Volume at the current scenario is significantly lower, which needs a sharp gain for a strong bounce back from the support area.
We can expect levels of $180 to $210 in upcoming trading sessions if the bulls overcome above the short-term SMA line of 20 and 50-day. Support on the lower side is at $130 and $118; simultaneously, resistance at the higher side is placed at $170 to $195.
Litecoin price at the monthly chart has been trading under the sideways pattern
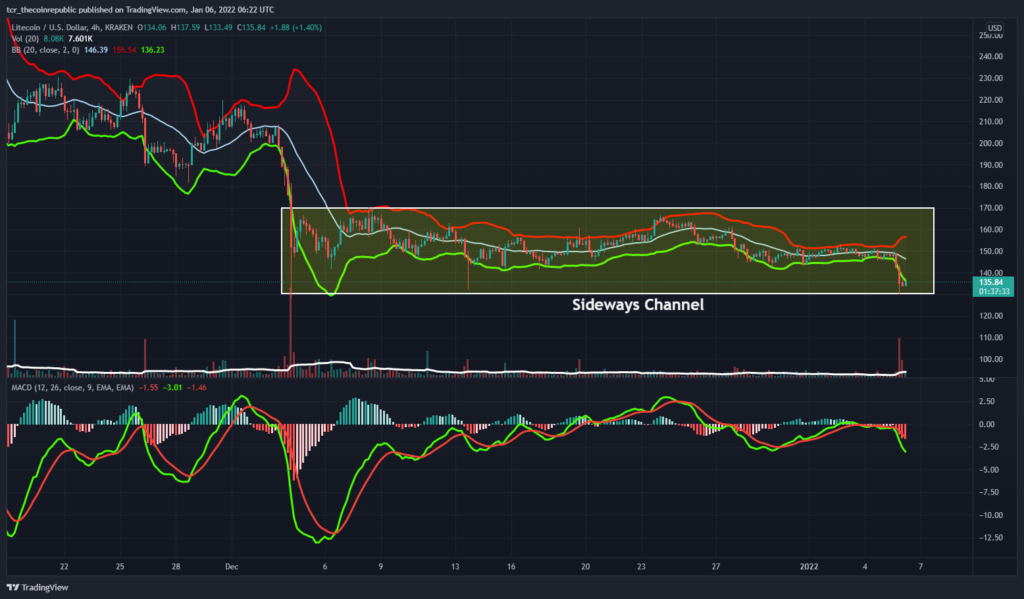
Litecoin price at the monthly chart has been trading under the sideways pattern and currently trading near the lower zone of the pattern. The technical parameters project a short-term selloff after a sharp decline from the higher levels. The bulls in the present scenario are trying to hold their previous swing lows with a slight increment in volume activity. Once LTC bulls hold the recent swing lows with supportive volume activity, they will push more buyers in upcoming sessions. LTC is currently trading at $136 with a 24-hours loss of -8.70%, while the volume to market cap ratio is 0.1269.
Moving Average Convergence Divergence (BEARISH): MACD indicates a sharp bearish trend on the daily chart. The sellers (red) are overpowering the buyer’s signal line (green) with a negative crossover.
Bollinger Bands (BEARISH): Litecoin price at BB is projecting an expanded move on the lower side of the weekly chart. No fresh short is recommended because the coin is placed under the Bollinger Bands’ lower zone.
Support levels: $130 and $118
Resistance levels: $170 to $195.
DISCLAIMER
The views and opinions stated by the author, or any people named in this article, are for informational ideas only, and they do not establish the financial, investment, or other advice. Investing in or trading crypto assets comes with a risk of financial loss.