
 Dacity Coin
 Celestia
 Quantus
 Bitcoin
 Pearl
Pearl Pons
Pons Injective
- AVAX Token price is moving in a downward parallel channel on a daily timeframe.
- The token forms a bullish flag and pole pattern on the weekly chart.
- The pair of AVAX/BTC is trading at 0.002135 with an increase of 2.5% in the market cap of the digital asset over the past 24 hours.
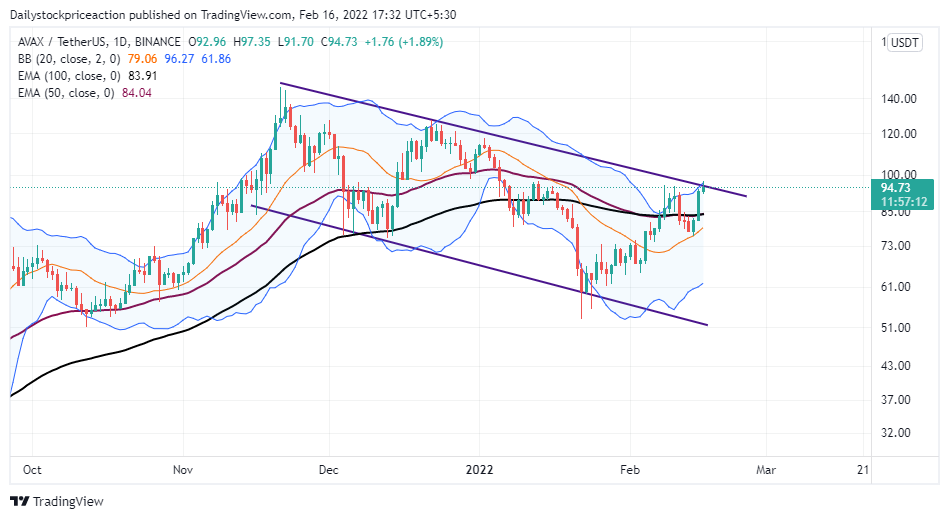
Source: AVAX/USDT by tradingview
AVAX token price is trading along with the resistance at $95. The token has been trading in a downward parallel channel for the past trading weeks. AVAX token price is forming lower low and lower high formation on daily timeframe. The token recently gave a breakout of all the vital Exponential Moving Average(20, 50,100), and after retesting it, token is trading above EMAs.The token is trading at the upper band of the Bollinger band indicator, and now it has formed a big bullish candle. If the coin breaks out of the purple trendline, it can start moving up to a short-term supply zone of $118.50.The token is forming a cup and handle pattern on a daily timeframe, and the $98 price level is made or break level for the token. Volumes have increased over the past trading weeks, indicating a presence of the bulls.
MACD and Supertrend are showing bullish signs on the daily timeframe
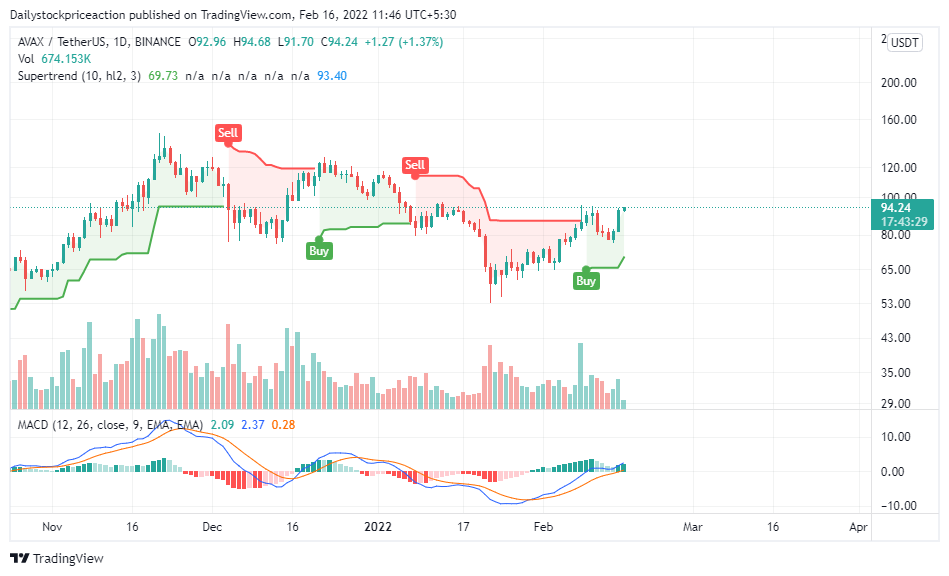
AVAX token price, as per the technical parameters, is turning bullish.
Moving Average Convergence Divergence (Bullish): MACD indicates a bullish trend on the daily time frame as it gave a positive crossover. The buyer’s (blue) signal line crossed the seller’s (orange) on the upside a week ago. Recently, the MACD side touched and bounced back again, indicating bullish momentum to continue for upcoming trading days. If the token breaks out of the purple trendline, the token price could reach
up to $115.
Supertrend: Recent bullishness in the token price has resulted in the breakout supertrend trendline at $87 and giving a buy signal. At present, the token is trading above the supertrend trendline, and once it breaks out $95, the token can be seen moving up rapidly.
AVAX Token price is forming bullish Flag and Pole pattern on the weekly timeframe
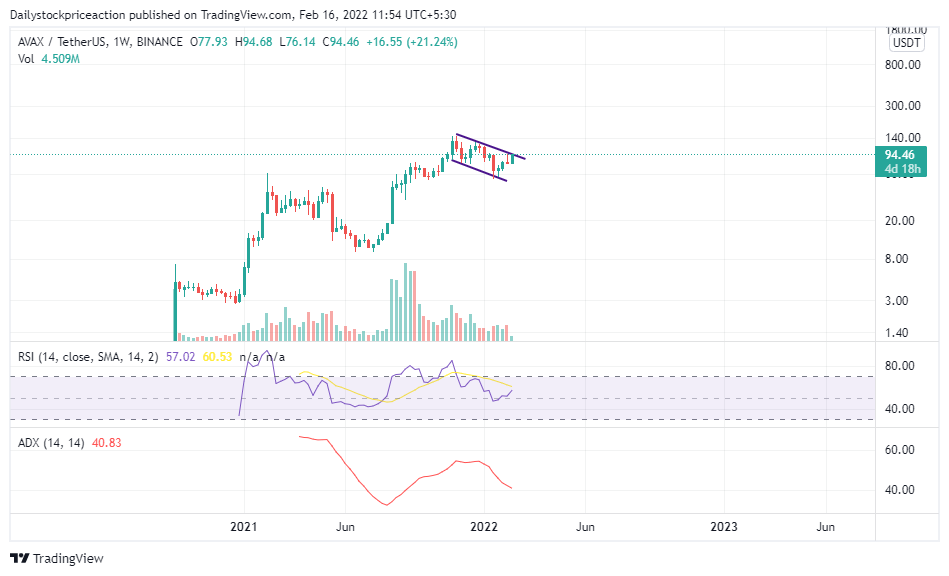
AVAX token price has been in an uptrend since its inception and is forming a bullish Flag and Pole pattern on the daily timeframe.
Average Directional Movement Index: ADX has been continuously dipping from the past trading days, and recently, it slipped below 40, as the token faced rejection at $95.The ADX curve is still in a neutral downtrend, thus indicating a halt in price movement.
Relative Strength Indicator: RSI is trading at 57.30after the token faced rejection and fell. The RSI curve fell out of the overbought zone and is also downtrend since the token started falling. The token is still trading above the halfway mark of 50. The RSI curve has crossed the 20 SMA curve, but recently the curve is nearing 20 SMA and can be seen crossing up in the coming days.
Conclusion
As per the price, AVAX token price is showing bullish signs. The technical parameters also suggest the same. It remains to see if the token can break out of $95 and move up to $115 or face rejection and fall to $60.
SUPPORT: $60 and $62
RESISTANCE: $115 and $120
Disclaimer
The views and opinions stated by the author, or any people named in this article, are for informational ideas only, and they do not establish the financial, investment, or other advice. Investing in or trading crypto assets comes with a risk of financial loss.




