
 Minter
 Quack AI
 NEAR Protocol
 Pearl
Pearl Monero
 Pons
Pons Sui
Sui
- GRT token price has fallen from the supply zone and now it is trading at $0.34.
- The token is forming a falling wedge pattern on a daily time frame.
- The pair of GRT/BTC is trading at 0.00000883 with a decrease of -0.20% in the market cap of the digital asset over the past 24 hours.
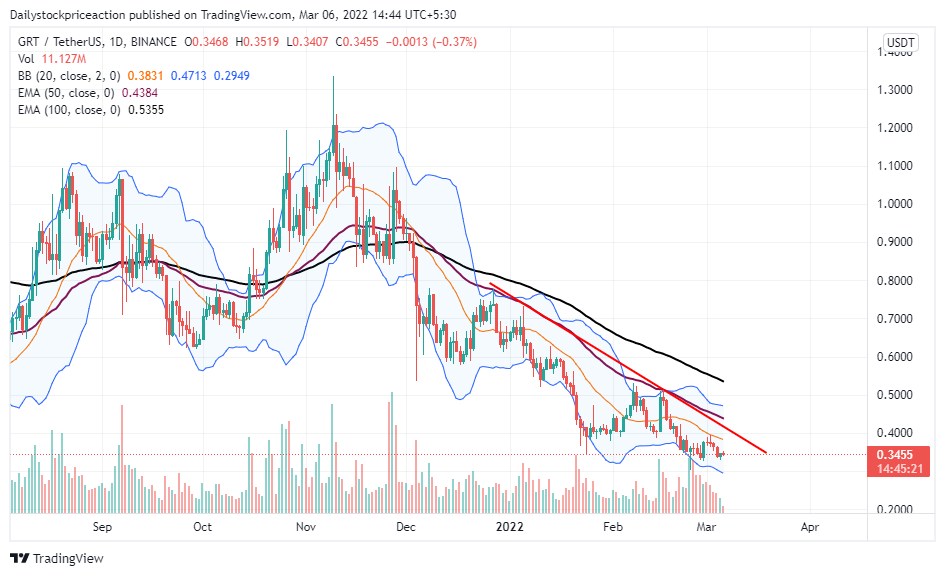
GRT token price is trading at the at the demand zone of $0.32 and it has formed double bottom pattern on daily time frame.The token is forming lower low and lower high formation on daily time frame.At present, the token is resting at a long term demand zone and thus if it is able to breakout of the red trendline on the upside then the token can be seen moving upside.But if the token breaks the demand zone it can fall rapidly.Currently, the token is trading below all the crucial Exponential Moving Average (20, 50, 100) and could face rejection moving upwards.GRT token price has been trading in a small range from past trading weeks and thus breakout on either side will trigger big move.The token is currently trading at the lower band of the bollinger band indicator after facing rejection at the upper band of the indicator.Volumes are flowing from both side increasing the volatility therefore breakout on either side will confirm the trend for upcoming trading days.
GRT token is forming Falling Wedge pattern on daily time frame
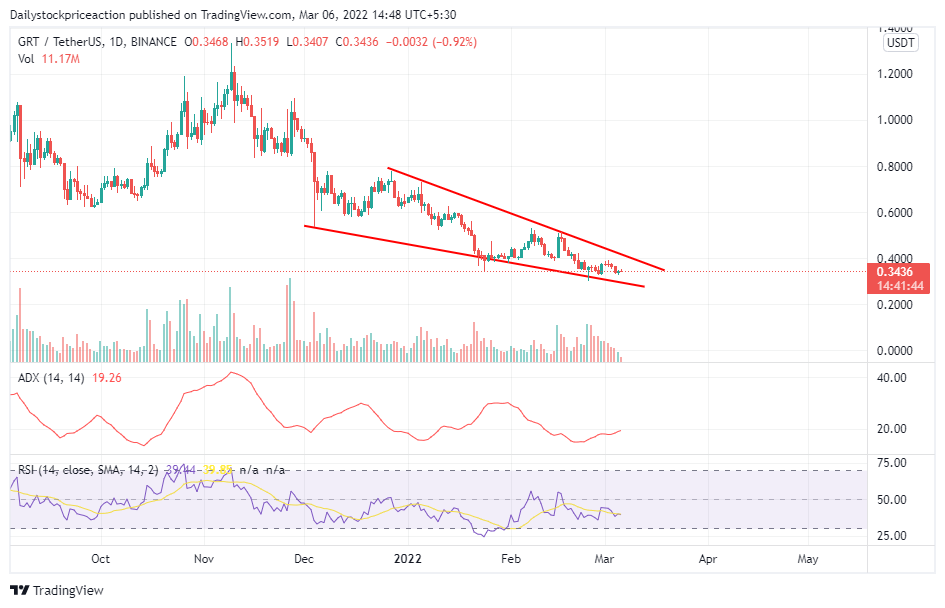
GRT token price is forming a bullish reversal chart pattern and the technical parameters are indicating the same.
Average Directional Movement Index: ADX has been continuously dipping from the past trading days, and recently, it slipped below 30, as the token faced rejection at $0.49. The ADX curve is seen recovering and at present it has turned upwards.Thus indicating a halt in the movement of the price and possible change in the structure of the price movement.
Relative Strength Indicator: RSI is trading at 39.44 as the token is forming a bullish reversal pattern. The RSI curve is nearing the 50 halfway mark and thus once it crosses the 50 mark the token can be seen moving up, possibly giving a breakout of the falling wedge pattern.The RSI curve has also gone past the 20 SMA indicating a bullish momentum for the upcoming trading days.
MACD and Supertrend are showing bullish signs on daily time frame
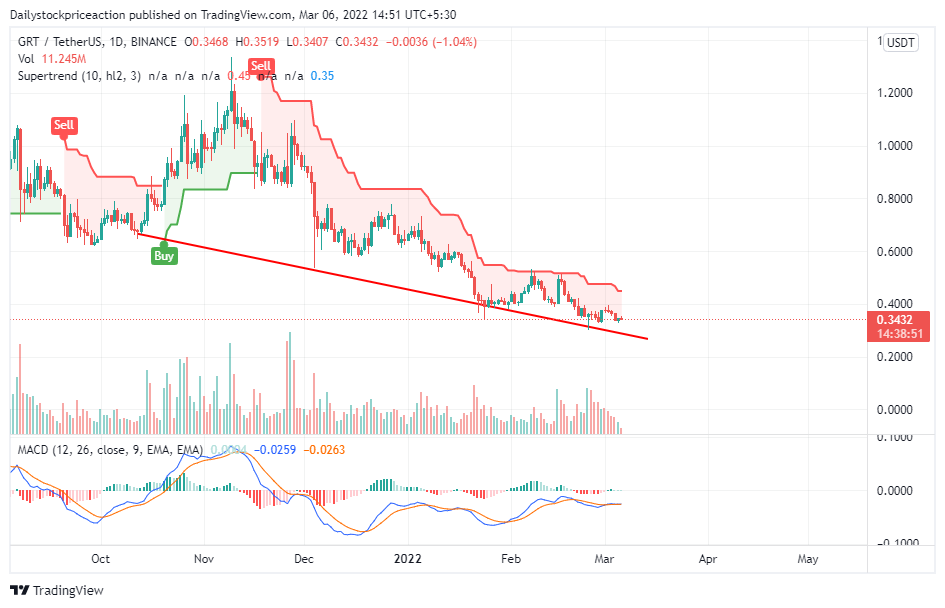
GRT token price is in a downtrend and recently it started trading in a small range, which resulted in the formation of a bullish chart pattern on daily time frame.And the technical parameters turning are showing the same.
Moving Average Convergence Divergence (Bullish): MACD indicates a bullish trend on the daily time frame as it gave a positive crossover. The buyer’s (blue) signal line crossed the seller’s (orange) on the upside. If the token breaks out of the green trendline, it can reach up to $0.49 and above. Possibly making new highs if the momentum continues.
Supertrend: Recent bullishness in the overall cryptocurrency market has not affected the super trend indicator. The sell signal from the supertrend indicator is still intact. GRT token gave a breakdown of the green supertrend trendline with a big bearish candlestick pattern which resulted in the indicator giving a sell signal.The indicator will trigger buy signal once the token surpasses the red supertrend trendline with big bullish candlestick pattern at $0.45
Conclusion
GRT token price, as per the price action is forming a bullish reversal chart pattern.The technical parameters are also suggesting the same.Investor should be cautious until the token breaks out on the either side.It remains to see if the token breaks on the upside or bears trample the price down to 0.32
SUPPORT: $0.32 and $0.34
RESISTANCE: $0.45 and $0.45
Disclaimer
The views and opinions stated by the author, or any people named in this article, are for informational ideas only, and they do not establish financial, investment, or other advice. Investing in or trading crypto assets comes with a risk of financial loss.




