Universal High Income
 OnlyAgent
 Aerodrome Finance
 Pearl
 Monero
 Bitcoin
 Quantus

- The Internet Computer Price hiked rapidly last evening with a gain of 11% in a single day.
- The price of ICP coin draws double bottom formation near above 5.0 support level.
- Buyers were offensive last night, hence trading volume shows more than average buying.
The Internet computer coin is placed sideways inside the horizontal border. Both the bears and the bulls try to maintain their dominance over the well-given altcoin, as a result, the bulls have set their hedge zone at $5.0 above the 2022 bottom; On the other hand, the bears appear aggressive in the $6.5 area.
In early June, buyers witnessed a sharp decline and saw 2022 lows at $4.6 points. During the hedge, speculators ride the roller-coaster over the past 30 days. Thus the price action of ICP Coin is forming a double bottom formation on the daily time frame.
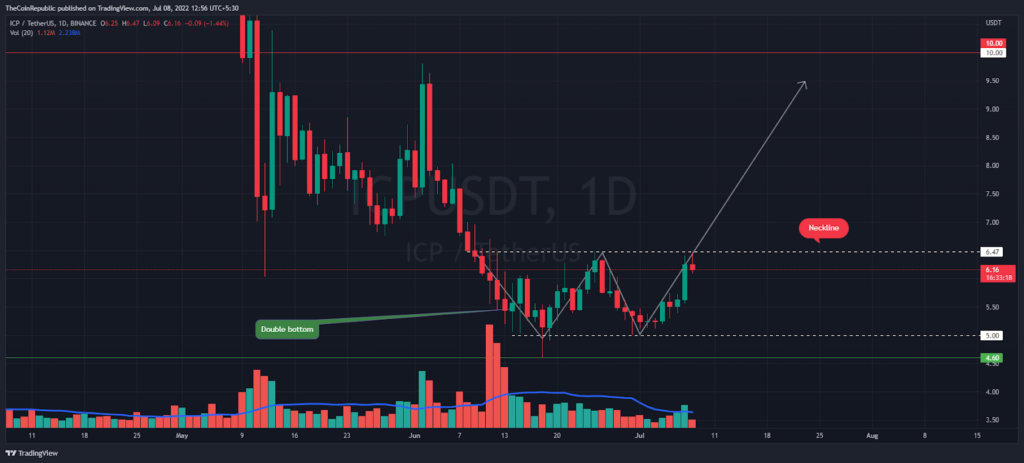
There is resistance near the neckline of the ICP coin double top pattern (at $6.5). Hence, altcoin price with USDT pair is facing a pullback here today. Thus, the altcoin is trading at the level of $6.11 at the time of writing. Similarly, the bitcoin pair corresponding to the bitcoin pair is in the green zone at 0.0002806 satoshis.
If ICP price breaks the $6.0-immediate support line again, the given bullish pattern could turn into a bear trap. If this happens then the consolidation could continue over a wide range of periods. But still, the internet computer coin is 15% bullish this week.
Why does the ICP price show correction?
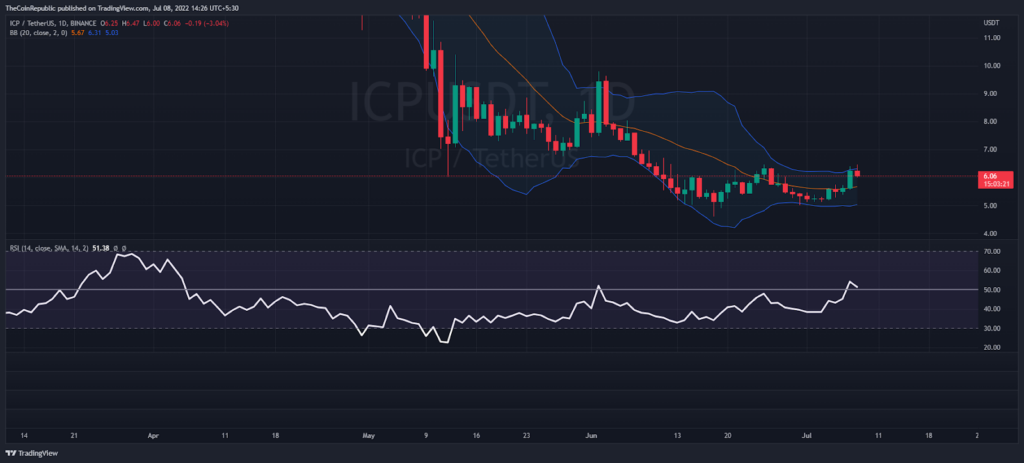
During a retracement, the upper band of the Bollinger Bands indicator appears to be a bears hedge zone. Meanwhile, the mid-band (20-day moving average) of the lower indicator could act as the most recent support for the bulls.
Moreover, the RSI indicator finally settled above the semi-line (50 mark) after a 4-month consolidation. But the RSI peak again halved in the context of the daily price chart window. If the RSI breaks below this support, the ICP price may decline further towards the $5.0 mark.
Conclusion
Internet computer investors struggle near the neckline of the double bottom formation. So if the altcoin price consolidates in this area for more than two days without breaking the 20 DMA, a bullish breakout could occur.
Technical Levels
Support level – $6.0 and $5.0
Resistance level – $10 and $20
Disclaimer
The views and opinions stated by the author, or any people named in this article, are for informational ideas only and do not establish the financial, investment, or other advice. Investing in or trading crypto assets comes with a risk of financial loss.