

- The battle of bears and bulls for the price of QTUM
- The QTUM has dropped by approx 10 % in the last 24 hours
- The pair of QTUM/BTC is at 0.0001726 BTC and has declined by 1.32% during the intraday trading session
Both bulls and bears may experience tragic situations as a result of QTUM’s volatile pricing. The bulls and bears are working so hard to get the QTUM price to the targeted levels. The shifting price range on the daily price chart makes it difficult for investors to determine the correct movement of the QTUM. The token has the potential to rise but the bearish trend is not giving a space to show its potential.
The current value of the QTUM is currently at $4 and it has dropped by 4.91% during the intraday trading session and the pair of QTUM/BTC is at 0.0001726 BTC and has declined by 1.32% in the last 24-hours. The bulls and bears are competing with each other to manipulate the market. The bulls are trying to give an upward momentum to the QTUM but the bearish trend is bringing it down again this is creating great confusion for the new investors.


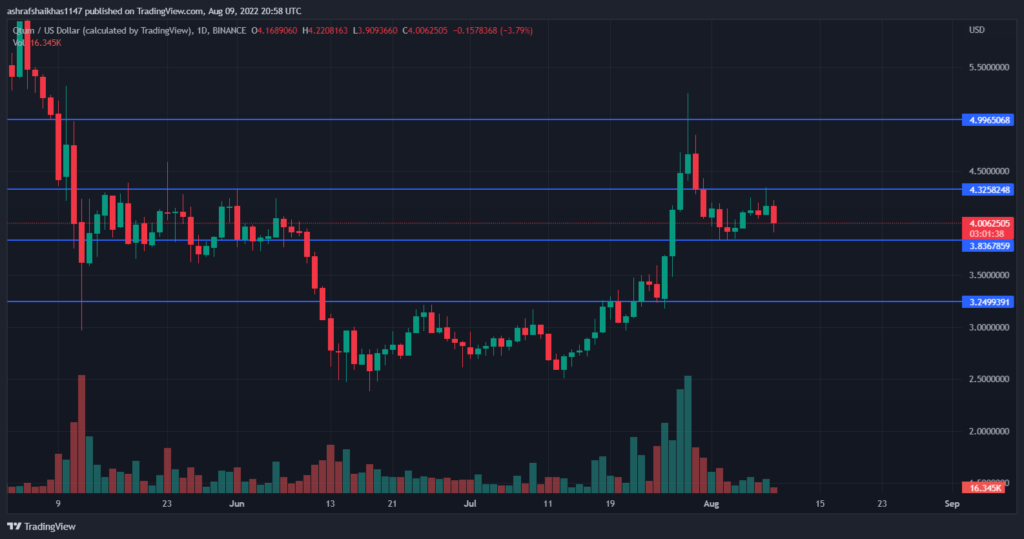
The price of QTUM reached the support of $4. The coin seems to follow the bearish trend the price may reach up to primary support of $3.8367 and if the bulls don’t enter the trade the price may reach secondary support of $3.2499 on the other hand if the bulls make the move it can also reach the primary resistance $4.3258 and if the price follows the bullish trend the price may reach up to secondary resistance $4.9965. This conflict between the bears and the bulls is making it too harsh for the traders to trade.
The volume to the market cap ratio of QTUM is currently at 0.1524 and the volume has dropped by approx 17.31% in the last 24 hours. This signals that bulls are attempting to enter the trade. The continuous fall in volume obviously suggests that selling pressure on QTUM has risen. But both bulls and bears are giving each other tough fights.
Let’s check what the technical indicators indicate about QTUM
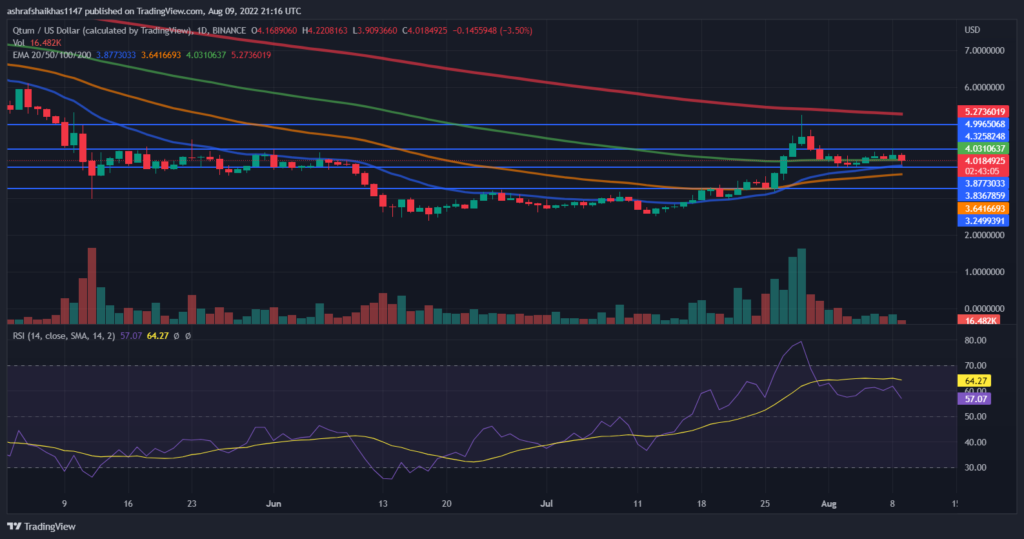
The coin’s price is higher than its 20,50 exponential moving average. And has reached its 100 exponential moving average Furthermore, the coin must still reach the 100,200 Daily Moving Average.
The technical indicator shows the following information: The Relative Strength Index is getting back from the overbought zone. The bulls worked hard to restore the RSI to the overbought zone. And the bulls succeeded but the bears made it difficult to maintain the RSI. The bears, on the other hand, took advantage of the bulls’ preparations and drove the RSI toward neutrality. But the bulls are also waiting for a window to execute their plans The current value of the RSI is 57.05 which is below the average which is 64.26 Investors are impatiently waiting for the appropriate move.
Technical Levels
Support Levels: $3.8367 and $3.2499
Resistance Levels: $4.9965 and $4.3258
Disclaimer
The views and opinions stated by the author, or any people named in this article, are for informational ideas only. They do not establish the financial, investment, or other advice. Investing in or trading crypto assets comes with a risk of financial loss.


