
 Pearl
Pearl Bitcoin
 NEAR Protocol
 Starknet
 Solana
 Quant
Quant Ondo
Ondo
- The KAVA token is rising in the lower time frame after breaking back from the support level.
- On the daily chart, the KAVA crypto is looking to be range bound in a narrow box pattern.
- KAVA’s market cap has increased by 5.58% to $435.6 million.
KAVA crypto is slowly rising in the time frame of 4 hours and less. This continued price recovery in price indicates short-term bullish momentum until the next resistance level is reached. In the intraday trading session, bitcoin reached the key round level of $20K thus many altcoins are showing positive trend today and KAVA is one of them.
KAVA on 4 Hour Chart
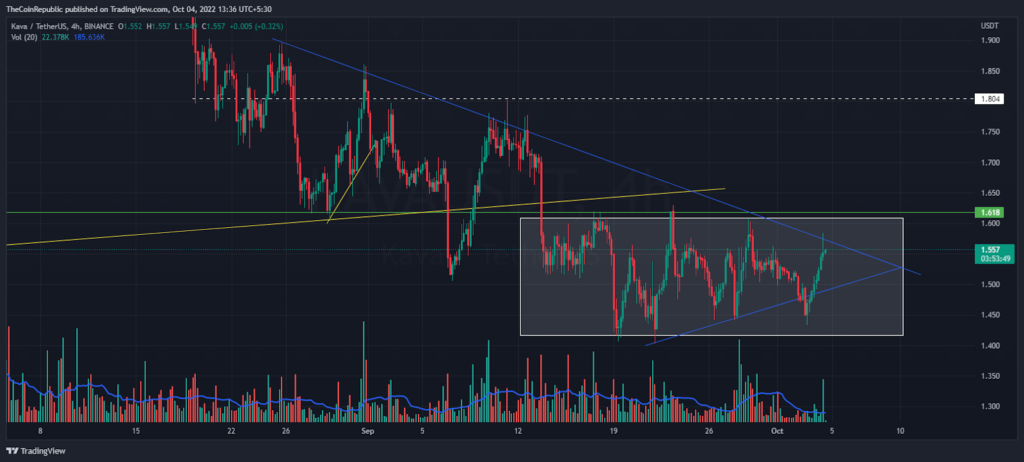
In the 4 hour chart, KAVA crypto is rising frequently after reversing from the $1.45 support level. This strong price recovery shows much buyers’ participation in this week. Later on, KAVA bulls resist the bearish trendline (blue), which is valid since late August. Buyers may struggle at this point to make rapid long-buildup.
For the past 20 trading sessions, KAVA token has been fluctuating under the narrow horizontal range, and price action shows a higher-low pattern. Buyers have support zones near $1.4 level, on the other hand, they often get higher price rejection at $1.6-resistance level. Price out of this box pattern could record directional momentum ahead.
KAVA Crypto on Daily Chart
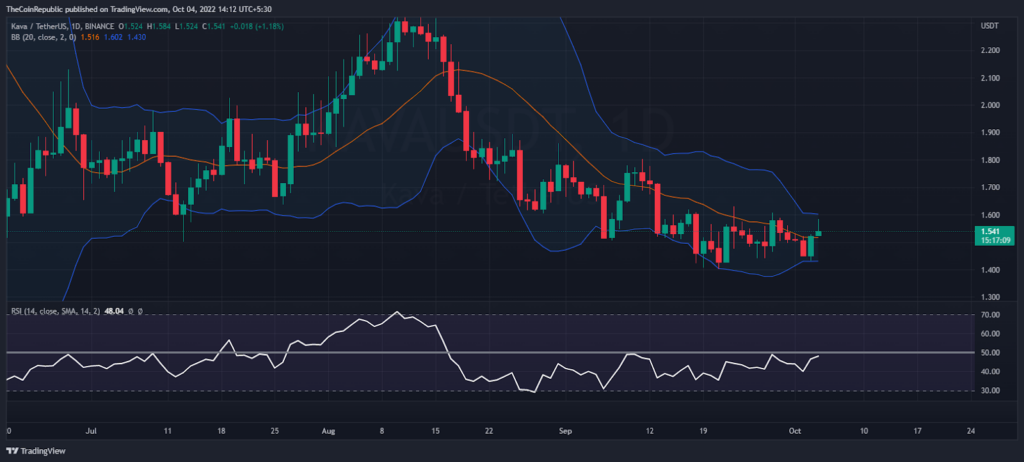
At the time of writing, buyers escaped the $1.5 level and the KAVA token was trading at the $1.54 mark. Daily price candles reflect strong buying from last night and a recovery of almost 10% from $1.43 to intraday high is recorded. Thus the price of Kava crypto pairing with bitcoin is up 0.83% at 0.000007735 satoshis.
KAVA’s market cap rose 5.58% to $435.6 million and trading volume increased 58% to $13.8 million overnight. Amid the recent price correction, the KAVA crypto has risen above the mid-band of the Bollinger Bands indicator in terms of the daily price scale. Also, the RSI indicator is slowly moving towards the semi-line.
Conclusion
The KAVA crypto has broken the mid-band of the Bollinger Bands indicator, which was a short-term up-side barrier. Now, price resistance is seen at the trendline and buyers may soon break this resistance line as the trading volume is gradually increasing.
Disclaimer
The views and opinions stated by the author, or any people named in this article, are for informational ideas only, and they do not establish the financial, investment, or other advice. Investing in or trading crypto assets comes with a risk of financial loss.




