
 Zcash
Zcash Sui
Sui Celestia
 Quantus
 Injective
 Hyperliquid
 LayerZero
- CCL is trading at $8.79 with a decrease of -4.77% on a daily basis.
- The low of the price is $8.68 and the high of the price is $9.72.
- The current price of CCL is below 20,50,100 and a 200-day EMA on a monthly basis.
CCL was in a bullish trend which took the price from $18 to $72 from the start of 2009. When the world took a hit from the pandemic the price broke below the trend line, retested it and again melted to $8 in a span of 2 months. CCL price then consolidated between the price band of $8 to $30. On the 1-daily trading chart, price is gaining bullish momentum as sales of the first quarter have increased, reaching the same level as they were before the pandemic. The price is presently in a bullish trend making higher highs and higher lows.
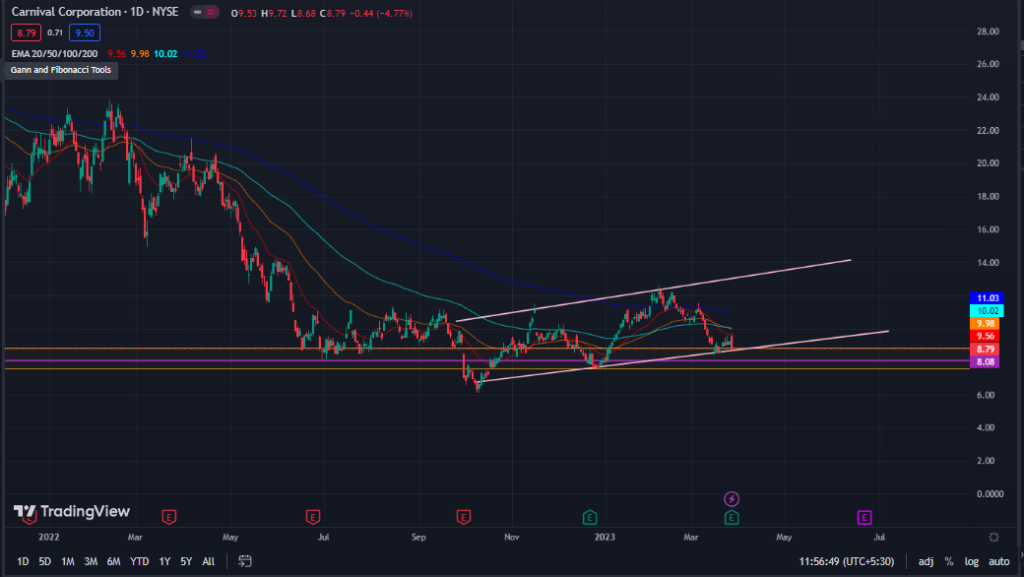
CCL price did break below the consolidation zone in October 2022 and rejected the $6 level. The price is presently in an upward channel since the rejection, making higher highs and higher lows. CCL has made a support at $8.50 on daily basis, if the bears are able to break below the support we can expect a clean move to $7.50 level and which will break the trend line and we can then expect the price to move downwards even further till $ 5 level.
The $8 support is a strong support level for price from the historical point of view. The price has presently made a higher low and if bullish behavior sustains there is a higher probability for the price to reach $13 level. The resistance made at $12 has to be broken in order to reach that $13 price level.
Technical analysis of CCL stock:
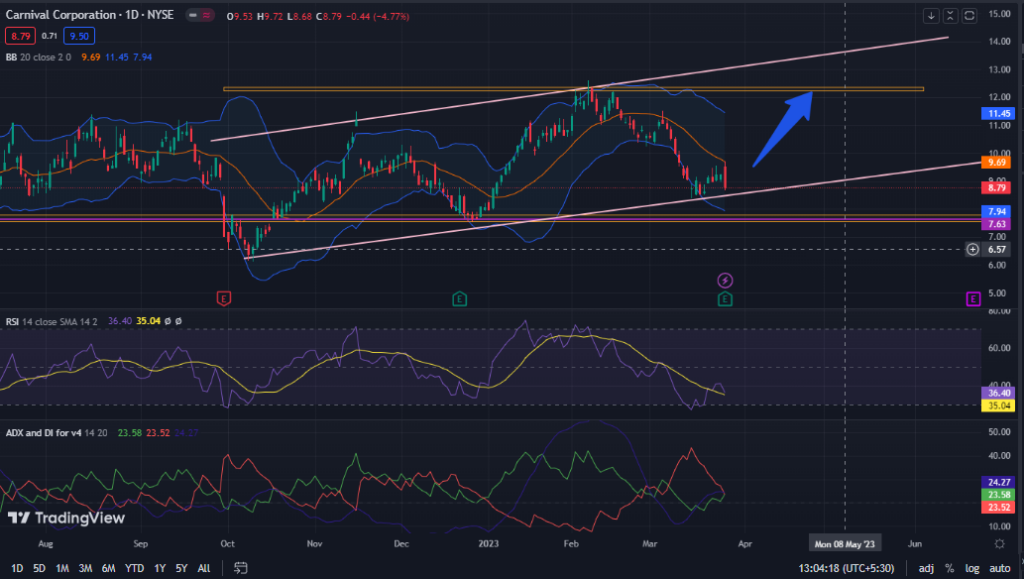
RSI curve is increasing from the overbought zone and has shown a positive cross over with median line of 14 day SMA indicating bulls pushing price upward. The current value of the RSI curve is 36.40 which is above the average value of 35.04. In a 4 hour time frame, the RSI curve is taking support from the median line to move higher.
The price is currently in the lower band of the bollinger band after receiving rejection from the 20 day SMA. CCL needs to make a strong support to sustain the bullish behavior. In a 4 hour time frame, the bands have squeezed indicating low volatility. The +DI is above the -DI, but the ADX is decreasing and is presently at 16.49 in a 4 hour time frame. In a daily time frame, -DI is above the +DI with ADX strength of 24.27. +DI will soon cross the -DI is upward direction in the daily time frame.
Conclusion:
CCL has taken a major hit due to the pandemic and is still trying to recover. The sales have reached to pre pandemic level and analysts are in favor of a bullish rally. The price action is presently bullish but price needs to stay above the trend line to again make higher highs. The market structure is indecisive as the previous candle is a strong bearish. The technical parameters are showing bearish behavior as price touched the lower trend line. CCL increasing sales can be a good sign for the earnings of the company and would result in strong financials.
Technical level:
Major support : $7.50 and $8.50
Major resistance : $9.70 and $11.50
Disclaimer
The views and opinions stated by the author, or any people named in this article, are for informational purposes only, and they do not establish financial, investment, or other advice. Investing in or trading crypto or stocks comes with a risk of financial loss.




