
 Pearl
Pearl Pudgy Penguins
 NEAR Protocol
 Quack AI
 Canton
 Starknet
 Derive
- The HNST stock is in a downtrend and trading at $1.65 with a decrease of -2.37% on a daily basis.
- The low of the price is $1.65 and the high is $1.74.
- The current price is way below the 20,50,100 and 200-day EMA.
Since the IPO of the Honest company, the price has been falling steadily. HNST stock opened at $21.22 and made a high at $23.88. Since then, the stock started its bearish rally. The negative earnings reported by the company since its IPO triggered fear in the investors, causing a price-fall.
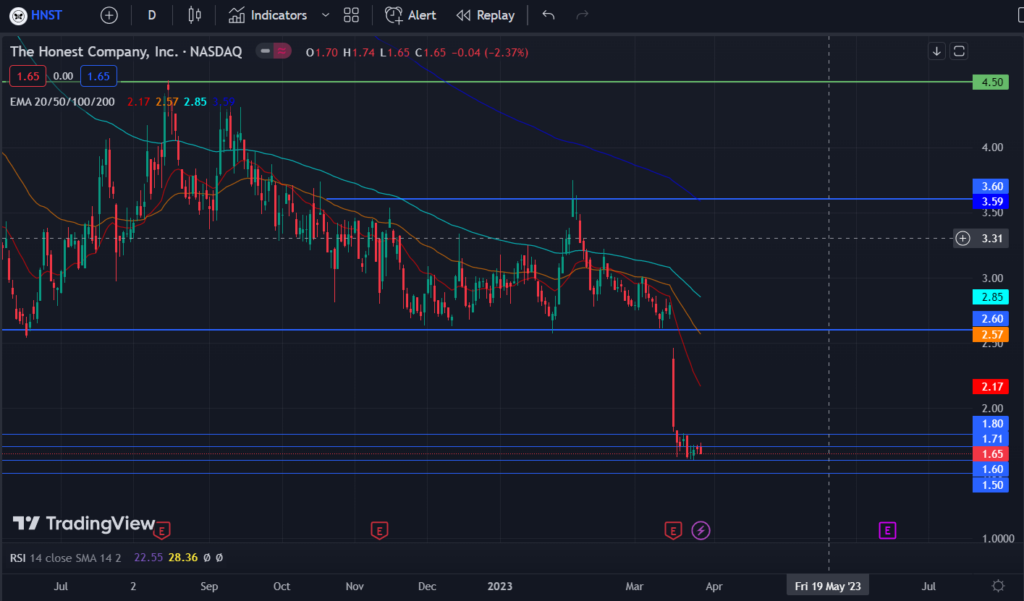
After breaking the $4.50 level, the price consolidated between the price band of $2.55 to $4.50 from the starting of May 2022. During mid-march, the Honest company reported its fourth quarter result with net losses which resulted in the breaking of the consolidation zone and price falling down to $1.60 level. The EMAs are indicating a strong bearish move. The honest company losses increased to $49 million as compared to $38.7 million in 2021.
Price needs to make a strong support on the $1.60 level to gain bullish momentum. A candle breaking and closing above $1.80 will give us a confirmation for the price to reach $2 level.
If price breaks below the $1.60 level, the easy target for price would be $1.40 level.
Technical Analysis:
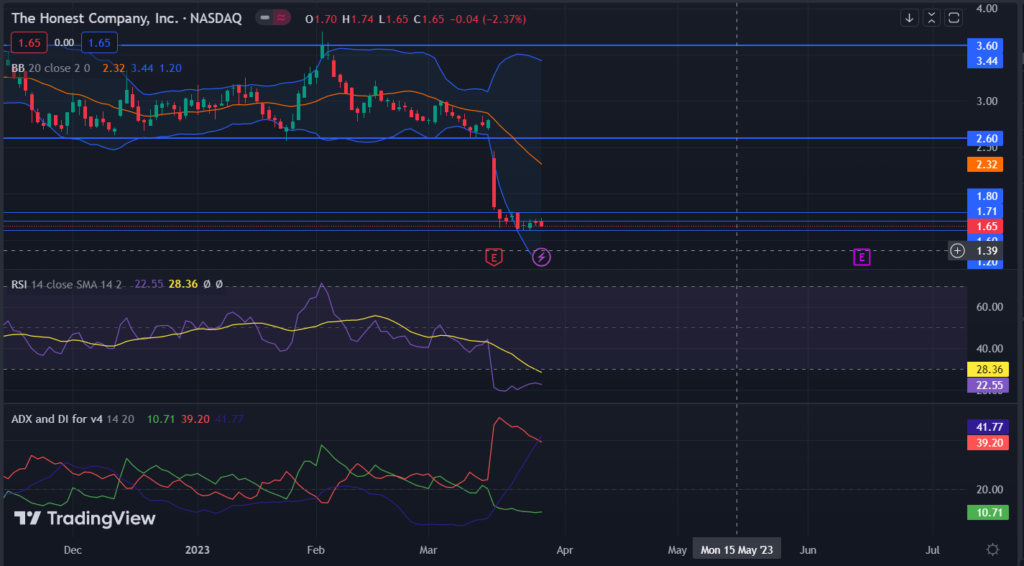
The RSI curve crossed the 30 mark reaching the oversold zone and is presently at 22.55. The RSI curve is gradually increasing after touching 20 mark. Price needs to sustain above the $1.60 level for creating an optimistic view for the bulls. RSI curve on the 4-hour chart shows a positive crossover with median line of 14 day SMA as price reached the$1.70 level.
The -DI is above the +DI , with ADX at 62.05 clearly indicating a strong bearish momentum on the 4-hour chart. On a daily basis, ADX is gradually increasing to 50 mark.
Conclusion:
The Honest company stock price suffered post the release of the quarterly report due to losses and diminutive increase in revenue growth. There are no bullish sentiments currently in the market for the HNST stock. The price needs to sustain the $1.60 level to signal bullishness. Technical parameters suggest a pullback if the bulls are able to take control and drive prices above the $1.80 level but the current trend strength is strong for the same.
Technical levels:
Major support : $1.60
Major resistance : $1.70 and $1.80
Disclaimer
The views and opinions stated by the author, or any people named in this article, are for informational purposes only, and they do not establish financial, investment, or other advice. Investing in or trading crypto or stocks comes with a risk of financial loss.




