
 Injective
 Pudgy Penguins
 Quantus
 Bitcoin
 Celestia
 Sui
Sui Derive
- Occidental Petroleum stock price near $60 support ahead of quarterly earnings.
- OXY stock price dropped below the 50 and 200 day EMA.
- Occidental Petroleum (NYSE: OXY) quarterly earnings scheduled on May 9, 2023.
Occidental Petroleum stock price corrected 10% approx from the recent swing high at $65.00. OXY stock seems to be consolidating in the wide range between $55.00 to $66.00 and might react violently after the release of earnings.
OXY stock price dropped below the 50 and 200 day EMA shows trend is reversing in downward direction. However, both the EMA is sloping sideways which also indicates prices lacked direction and might consolidate for some more time.
Occidental Petroleum (NYSE: OXY) quarterly earnings scheduled on May 9, 2023. Market analysts estimated the EPS of $1.243 and revenue estimates are $7.46 Billion. If the company succeeds to meet the estimates then we might see stock prices to rally toward $66.00. However, if the company disappoints in results then stock might react negatively and retest the lower range at $55.00.
OXY stock price tried multiple times to break out of the $66.00 but it got rejected indicating strong bears are active on higher levels. Therefore it will be difficult to break the higher range and expand upward. In the previous quarter result OXY stock did not react much and remained in range. However, in this earning sharp up-move or down-move is possible.
Will Occidental Petroleum stock rebound?
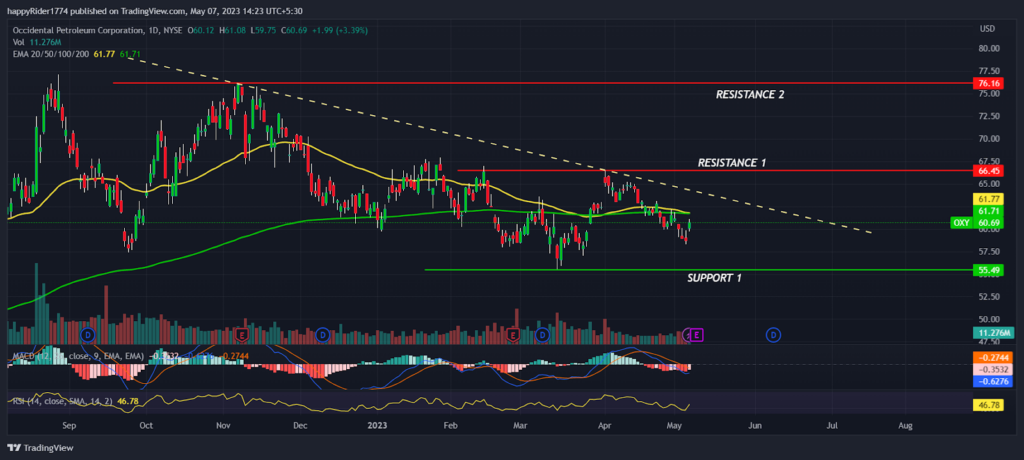
Occidental Petroleum stock faced resistance in the downward sloping trendline and formed a bearish pattern. Till OXY stock price is trading below the Trendline the short term trend will remain weak. But if buyers succeed to break out of the $66.00 hurdle level then the next phase of the rally might begin. Till price sustains above $55.00 the long term investors are safe and probability of rebound is high.
On the other hand, if the price drops below $55.00 then it will trigger the negative sentiment and the bear may try to drag it further down to $50.00. The technical analysis suggests, OXY stock price is near to the demand zone and might show turnaround after release of quarterly earnings.
OXY stock price: Technical outlook
OXY stock price formed a bullish hammer candle on the weekly time frame indicating buyers hesitate for more downside. But the price will pick up momentum only after the $66.00 breakout. Till then prices are expected to consolidate in the range mentioned in the chart.
The technical indicators like MACD curve is reversing upward indicates mild bullishness. The RSI at 46 sloping upward denotes the strength of bulls and prices are near to the neutral zone.
Conclusion
Occidental Petroleum stock price corrected 10% approx from the swing high and faced hurdle at the trendline. However, OXY stock price is near to the demand zone and quarterly earnings are scheduled on May 9, 2023 which might decide the next direction. If NYSE: OXY succeeds to meet the analyst estimate then the probability of rebound will also increase.
Technical levels
Resistance levels : $66.00 and $76.00
Support levels : $55.00 and $50.00
Disclaimer
The views and opinions stated by the author, or any people named in this article, are for informational purposes only. They do not establish financial, investment, or other advice. Investing in or trading crypto assets comes with a risk of financial loss.




