
 Dacity Coin
 Celestia
 Quantus
 Bitcoin
 Pearl
Pearl Pons
Pons Injective
- Zilliqa Price formed a double top bearish trend reversal pattern.
- Zilliqa crypto price dropped below 50 and 200 day EMA.
- ZIL price corrected 28% approx from the recent swing high.
Zilliqa Price corrected 28% approx from the recent swing high and formed a double top bearish pattern. It shows the initial signs of the bearish trend reversal. However, the confirmation of the trend reversal will come when the ZIL price will break down the neckline support.
ZIL price corrected a lot and is approaching the demand zone at $0.02532 which will act as immediate support in coming weeks. Zilliqa Price dropped below the 50 and 200 day EMA showcase positional trend is still in the downward direction. Recently, it witnessed a spike in the trading volume and prices reacted violently but sadly bears took over control and prices reverted down.
Zilliqa Price is trading at $0.021610 with an intraday decline of -1.10%. The 24 hour volume to market cap ratio is 0.0516. In the mid of February, Zilliqa Price managed to climb above the 200 day EMA and attempted to break out of the $0.03500 hurdle level. Sadly, the attempt failed and prices faced rejection from the higher level.
Slow and steady prices declined by forming lower lows and eroded the majority portion of the previous gains. The downfall halted near $0.02000 and formed a bullish hammer candle. It created a hope of the bullish trend reversal and prices showed a decent recovery from the lows.
Will Zilliqa Price rebound or continue to decline?
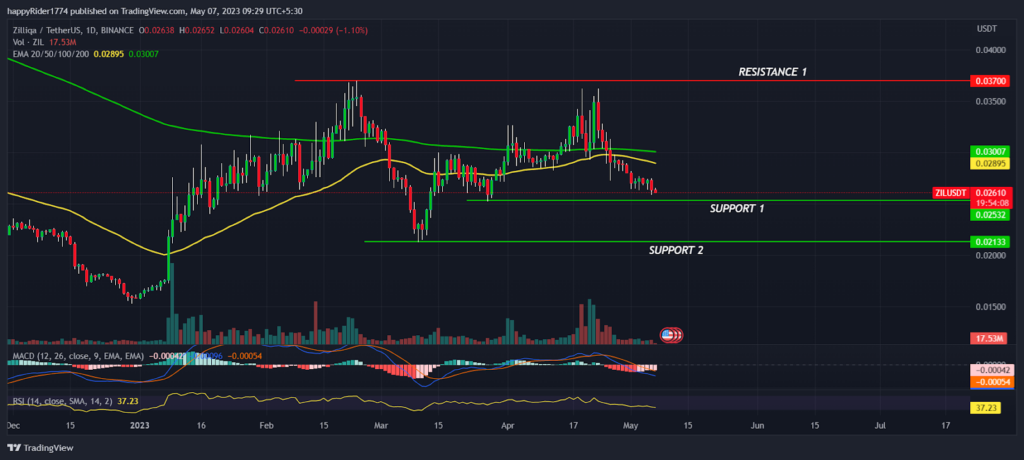
Zilliqa Price attempted twice to break the $0.0300 hurdle but gets rejected indicates strong bears are active on the higher levels. Presently, ZIL prices are near to the demand zone. If price begins to consolidate then it may be an indication of availability of buyers at lower levels.
However, if the sell off continues and prices dropped below the $0.02000 support then it might raise concern for the long term investors. On the other hand, if the price managed to climb above both the EMA then we may expect the halt in correction.
The technical analysis suggests, Zilliqa price is in correction mode and no signs of recovery is visible. However, till price sustains the $0.02000 support the downside seems to be limited.
ZIL price analysis with BTC pair
The ZIL price with BTC pair is also in a strong downtrend and keeps on hitting the yearly lows. The correlation of ZIL with the BTC pair is 0.37 which is quite low and sellers seem to be highly active in this pair.
Zilliqa price rejects 200 day EMA and witnessed sharp profit booking. Therefore, It seems correction is going on in both pairs and no signs of recovery are visible. However, price is near to yearly lows and a relief rally may trigger any time to clear the short positions.
Conclusion
Zilliqa price corrected 28% approx from the swing high and formed a double top bearish pattern. However, the confirmation of the bearish pattern will come when price dropped below neckline support. The technical analysis suggests, ZIL price is in bear grip and no signs of recovery is visible. However, till price sustains the $0.02000 support the downside seems to be limited.
Technical levels
Resistance levels : $0.03500 and $0.04000
Support levels : $0.02532 and $0.02133
Disclaimer
The views and opinions stated by the author, or any people named in this article, are for informational purposes only. They do not establish financial, investment, or other advice. Investing in or trading crypto assets comes with a risk of financial loss.




