
 Pearl
Pearl Bitcoin
 NEAR Protocol
 Starknet
 Solana
 Quant
Quant Ondo
Ondo
- ApeCoin Price fell 18% in the previous month and formed a bearish pattern.
- APE Price struggles to defend the yearly lows at $2.618.
- The ApeCoin crypto price is trading below the 50 and 200 day EMA shows downtrend.
ApeCoin price fell 18% in the previous month and formed a bearish pattern. APE price slipped down by forming lower lows swings and eroded the gains generated in the past few months.
ApeCoin Price is faced resistance from the 50 day EMA and continues to trade below both the EMAs shows downtrend. However, the price has gone far away from the 200 day EMA. Therefore, short term pull back is possible.
APE price performed well in the beginning of 2023 and hit a swing high at $6.445. Later, The profit booking triggers from the higher levels and slowly the trend reverses in the downward direction.
ApeCoin Price is trading at $3.196 with an intraday decline of -3.44%. The 24 hour volume to market cap ratio is 0.0602. The pair of APE/BTC is trading at 0.00011945 with an intraday decline of -2.19%.
The price chart of ApeCoin with the Bitcoin pair is in downtrend and sellers seem to be continuing the dominance on higher levels. The trading volume in ApeCoin crypto is in a declining phase shows prices might consolidate near to yearly lows.
Will ApeCoin price take reversal form the support
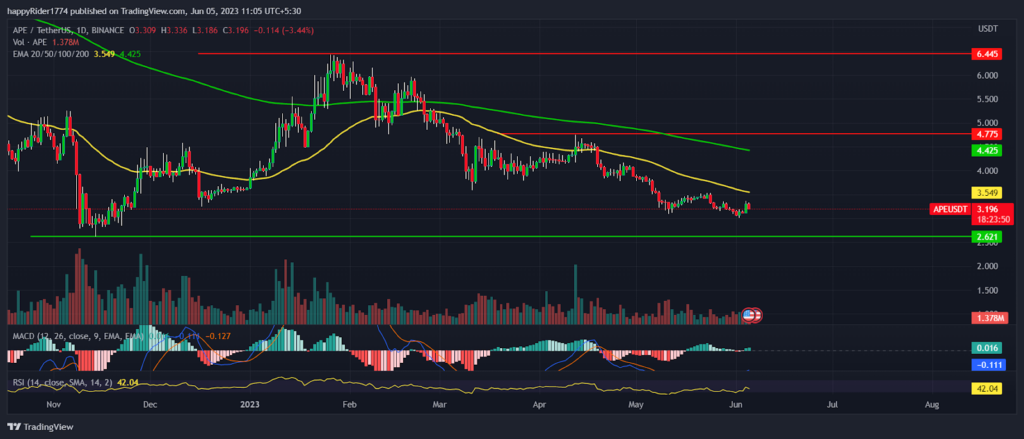
The downfall in the ApeCoin Price seems to be taking a halt near $3.00 which will act as immediate support in coming days. However, the market leader Bitcoin Price is mildly bearish and broke down the $27,000 level. It might negatively impact the sentiment of the overall market and prices of other altcoins.
ApeCoin price does not show any signs of reversal and any short term pull back will face difficulty to sustain on higher levels.Till price is trading below $4.775 it is expected to remain in the bear grip.
However, if the miracle happens and buyers succeed to break the $4.775 then sharp up-move toward $6.00 is possible. The technical analysis suggests, ApeCoin price is in downtrend and possibility of reversal remains low.
APE price unable to give follow up of bullish candle
The ApeCoin price formed a bullish hammer candle in the weekly time frame but the buyers failed to give the follow up. The APE price falling for eight consecutive weeks shows the dominance of sellers.
The technical indicators like MACD curve intersect positively with the moving average. It shows mild bullishness but the curve is sloping sideways indicates consolidation in coming weeks. The RSI at 42 sloping down denotes weakness and prices might test the oversold territory.
Conclusion
ApeCoin Price fell 18% in the previous month and the downfall is still continuing. However, the APE price is near to the yearly lows and short term relief rally is possible. But it will face difficulty to sustain on higher levels until it breakout of the $4.775 hurdle.
Technical levels
Resistance levels: $4.000 and $4.775
Support levels: $2.261 and $2.000
Disclaimer
The views and opinions stated by the author, or any people named in this article, are for informational purposes only. They do not establish financial, investment, or other advice. Investing in or trading crypto assets comes with a risk of financial loss.




