Quack AI
 Pudgy Penguins
 Starknet
 Pearl
Pearl Sui
Sui Celestia
 Quantus
- MSFT stock was continuing to surge in the past weeks.
- Bulls are maintaining the gains and holding strength.
Microsoft stock retained tremendous buying in the past weeks, showing a rounding bottom formation where stock persists to form higher highs and gave an inclining move. Recently, MSFT stock noted a consecutive profitable earnings report showing a net income increase of 9% to $18.3 billion and revenue growth of 7% to $52.86 billion.
Moreover, the chart shows that the stock has risen by taking support on every down mark but not giving up the momentum.
Bulls gained momentum when the stock cleared the critical mark of $300, and mighty bears left their positions. After that, the stock does not take a rest and resumes flying higher.
Moreover, the trading volume also increased by 3.45% to 25 million. Based on the chart formation, MSFT stock noted an immediate resistance of $350. The stock will soon try to break $360 if buyers escape above that. On the other hand, if the price reverts from the supply zone, then immediate support of $320 will be retested.
At the press time, MFST stock was at $335 during the close of Friday trading session with a surge of 0.85%. Moreover, the trading volume was noted at 25.874 Million.
Daily Charts Shows Rounding Bottom Pattern
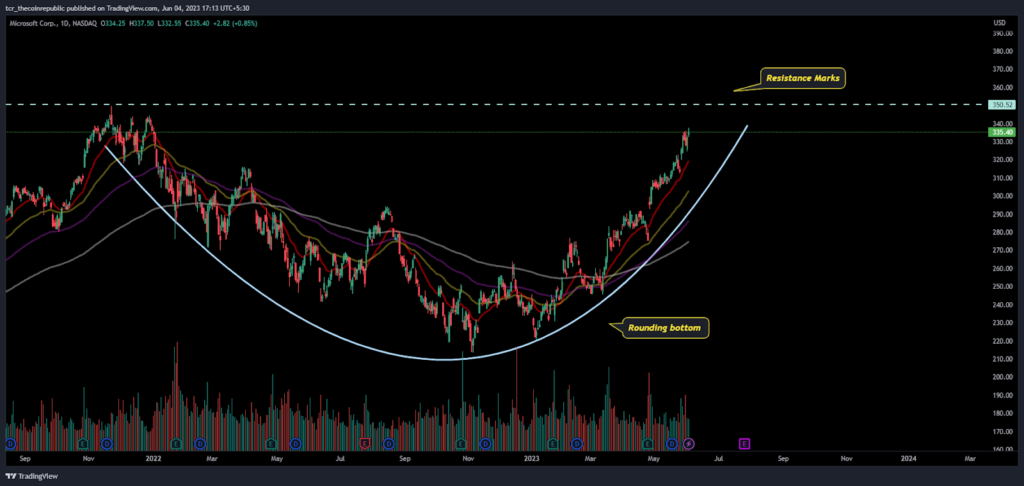
On the daily charts, Microsoft stock is flying beyond the imagination and rising from the ashes, where buyers showed their dominance and continue to stretch out. Intense buying was carried forward after the neckline breakout of $315, and stock escaped a 20-day EMA.
Moreover, MSFT trades above the significant moving averages. The mighty bears are protecting their positions and indicating a lack of strength.
Moreover, MSFT stock has risen the gains inside the rising channel and breaks every following resistance mark without retracement, showing the strength of buyers holding the trajectory swings.
Short Term Charts of MSFT
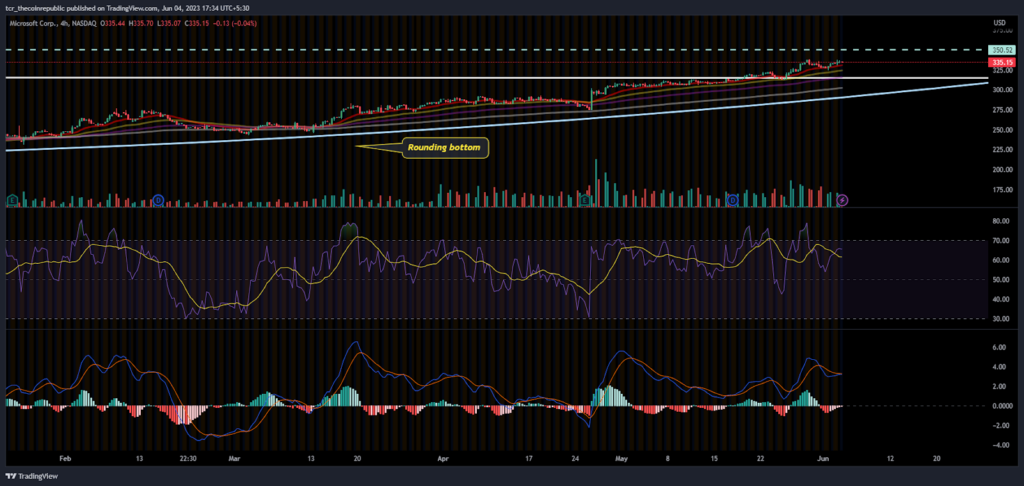
On the 4-hour charts, Microsoft stock price shows a pause near $335, and little profit booking was noted with a higher low sequence. Moreover, bulls held the region, and sellers tried to break the bulls’ momentum. The battle was at an exciting stage. From the start of 2023, MSFT stock was under the hands of bulls, and buyers persisted in accumulating the stock and gained by more than 40%.
The RSI showed a slide from the oversold region, and a retracement was noted, which led to a slight profit-booking trend. Moreover, the curve gave a negative crossover, encouraging sellers to take short positions.
The MACD indicator began to plot red bars giving a bearish crossover, but it did not last long.
Conclusion:
The price of Microsoft stock ( MSFT ) is bullish, and buyers persist in earning the gains.
Technical Levels-
Resistance level- $350
Support level- $320
Disclaimer-
The views and opinions stated by the author, or any people named in this article, are for informational purposes only and do not establish financial, investment, or other advice. Investing in or trading crypto assets comes with a risk of financial loss.