
 Boomer
 Minter
 Pearl
Pearl Pudgy Penguins
 Sui
Sui Covenant x402
 Pump.fun
- Roku Stock Price (NASDAQ: ROKU) up by 13% on a weekly basis and formed a bullish reversal pattern.
- Roku Stock sustains above the 50 day EMA and attempts to break the 200 day EMA.
- Roku Stock rose by 67% approx on a YTD basis.
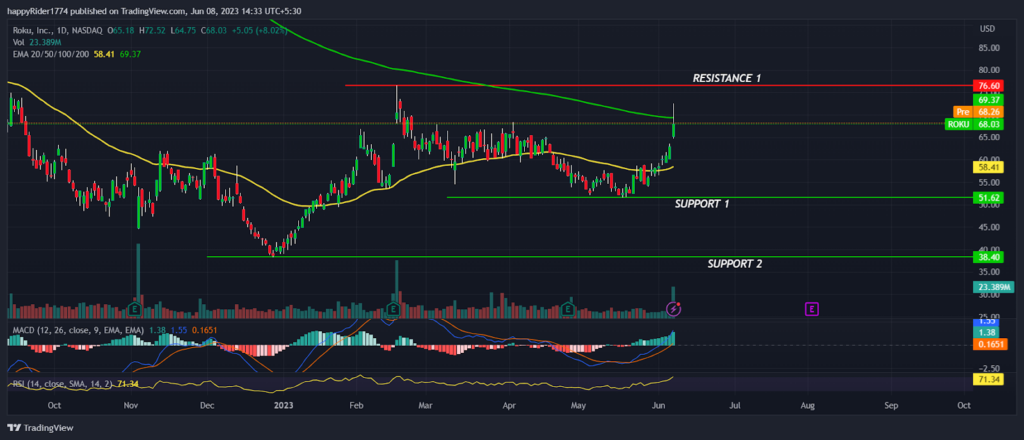
Roku Stock Price (NASDAQ: ROKU) rose 13% in the current week and displayed a bullish continuation pattern. The stock prices are rising upward by forming higher highs and trying to break the swing high hurdle at 76.00.
Roku Stock sustains above the 50 day EMA shows the short term is working in the favor of bulls. Presently, the 200 day EMA is acting as a hurdle and sellers are trying to reject the price from the higher levels.
Roku stock showed a surprising recovery from the recent swing low at $51.00 which created a hope for a turnaround in the stock. The volume also increased with the rise in prices indicating some genuine buyers had turned bullish and expecting the rally to continue for a few weeks.
Roku Stock price has formed a strong base near $50.00 and the support levels are shifting higher. It shows that the buyers are active at lower levels and short term correction will be easily absorbed.
Roku Stock price closed the previous session at $68.03 with an intraday rise of 8.02%. The market capitalization stands at $9.58 billion.
Is the Roku Stock Price in bull run?
Roku Stock Price up 17% in the current month and trading near to the YTD highs. The strong bounce back in Roku is due to the AI buzz in the market. Many other tech stocks are also on rise indicating more and more investors are participating in the rally.
The momentum in the recent up-move in Roku stock looks strong and prices are likely to sustain the higher levels. If the buyers are able to hold the price above $60.00 the rally might continue to $76.00.
The next phase of the bull run will begin when buyers break out of the $76.00 hurdle. On the other hand, if the price faces rejection and drops below $60.00 then the up-move will be considered as a trap.
The technical analysis suggests Roku Stock is gaining momentum and if it breaks $76.00 then $100.00 is possible.
Roku Stock formed 3 white shoulder pattern
Roku Stock formed 3 white shoulder patterns on a weekly time frame and recovered the losses of the past seven weeks. The stock is near the higher range of consolidation and the possibility of breakout is high.
However, Until the $76.00 breakout happens, it will be risky to create fresh longs. The MACD has generated a positive crossover and the curve is rising upward.
The histogram bars are also rising indicating the bullish momentum might continue. Whereas, the RSI at 71 sloping upward denotes strength. However, the prices entered into overbought territory so, the up-move may halt for some time.
Conclusion
Roku Stock Price (NASDAQ: ROKU) rose 13% in the current week due to AI buzz in the overall market. Roku stock formed a bullish reversal pattern and attempting to break the 200 day EMA.
The technical analysis suggests, If Roku stock breaks $76.00 then the next phase of bull run might begin.
Technical levels
Resistance levels: $76.00 and $90.00
Support levels: $51.62 and $38.40
Disclaimer
The views and opinions stated by the author, or any people named in this article, are for informational purposes only. They do not establish financial, investment, or other advice. Investing in or trading crypto assets comes with a risk of financial loss.




