Boomer
 Pearl
Pearl Covenant x402
 Claudia
 Bitcoin
 hi
hi NEAR Protocol
- TRX shows selling pressure in the last trading sessions.
- Bulls were trying to hold the sudden reversal over the top.
Tron coin price shows a reversal after the steep inclination from the lows of $0.5500 and continued to emerge. Moreover, the price action was still bullish and took support on the 20-day EMA, whereas TRX could not extend the gains and take a reversal ride due to the broad selling in the crypto market. This stoppage led to a down move, and bulls struggled to hold the momentum near the strong support mark of $0.7600.
In the last sessions, sellers showed their presence and made short positions leading the front, and the price dropped by more than 5 % in the previous three trading sessions.
This retracement of price is near a support mark of 20-day EMA, and a bounce is on the verge.
The price action was still bullish, and the buyers still had attained momentum. TRX coin was under the hands of buyers for the past few sessions.
When writing, the TRX coin trades at $0.07729 with an intraday drop of 0.67%, showing a down move. Moreover, the pair of TRX/BTC is at 0.0000029 BTC, and the intraday trading volume increased by 2.50% to $310.34 million. The day high of TRX is $0.07785, and the day low is $0.07640, showing a reversal. The market cap of TRX is $6.97 billion.
Daily Charts of TRX coin
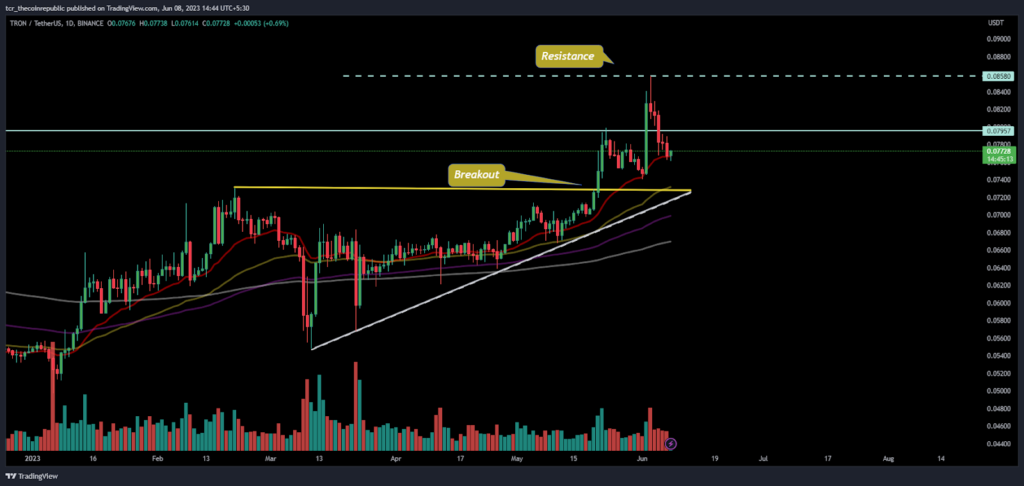
On the daily charts, the TRX coin was in bullish territory and showing neutral sentiments based on the retracement in price.
The ongoing trend indicates that if the coin attains a bounce on the 20-day EMA, then buyers will again look to retest the swing of $0.8500 and try to escape the mark. On the other hand, if sellers continue to force the bulls, the following support mark is near the neckline of $0.7200.
As per the Fib levels, TRX is near to 61.8% level and will take support at $0.7400, which is the substantial support range. Moreover, if it drops further, secondary support is near $0.7200.
Short Term Charts Shows Breakdown
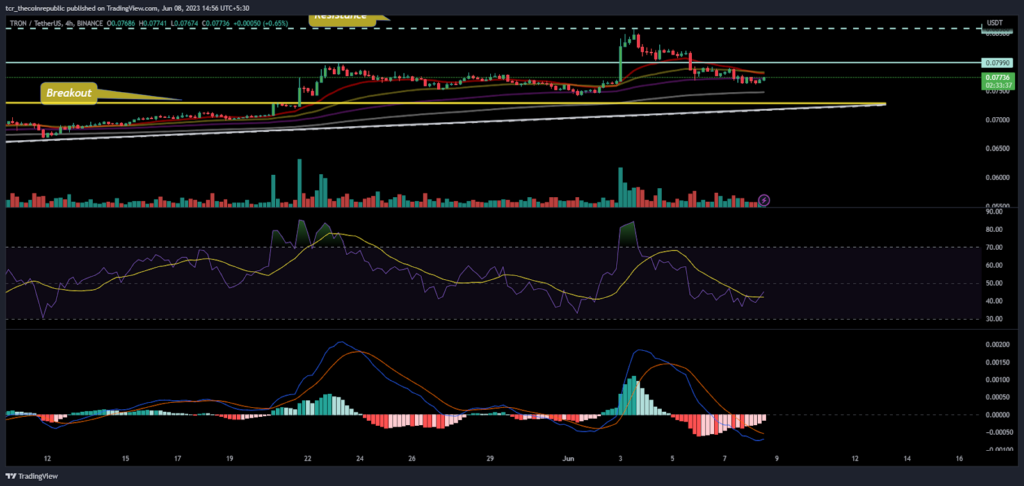
On the 4-hour charts, the price action shows a bearish outlook because of the steep decline and drop down in the momentum of bulls. The sellers are looking in perfect shape and trying to break the voyage of bulls which they gained earlier.
The RSI shows a reversal from the overbought zone, breaking the neutral mark of 50, hovering near 40. Moreover, a negative divergence formed on the charts led to a down move.
The MACD indicator shows a bearish crossover and continues to form red bars on the histogram, indicating the ongoing selling of the coin.
Conclusion:
TRX coin shows trend reversal and retracement from the top swing of $0.8500 and looks at seller engagement in the last sessions.
Technical levels:
Major support: $0.07300
Major resistance: $0.08500
Disclaimer:
The views and opinions stated by the author, or any people named in this article, are for informational purposes only and do not establish financial, investment, or other advice. Investing in or trading crypto assets comes with a risk of financial loss.