Universal High Income
 Dacity Coin
 Irys
 Pepe
 Pudgy Penguins
 Aerodrome Finance
 Sui

- RUNE token is forming a base near $1.10 and looking for a bounce.
- Bulls are accumulating the token but lacking momentum.
Thorchain token or RUNE price has been hovering near the support mark of $1.10 for the past weeks and looking for a bounce from there. Moreover, a double bottom pattern was also formed on the charts, which convinced the buyers that a pullback might be there, which can be seen in the upcoming sessions.
Furthermore, the price pauses the 20-day EMA and is trying to sustain above that. If buyers succeed in crossing and maintaining, further follow-on buying could be the price onward the 50-day EMA near $1.30. However, the technical parameters suggest a neutral perspective due to the decent volumes on the chart.
Based on chart formation, there was an inverted cup and handle pattern last month, which led to the price breakdown and RUNE token retesting the lows near $1.00. Afterward, the price stayed in the narrow range and held the gains but did not go for a bounce. Now, the token looks for the pullback and is trying to reclaim the sweet spots near $1.30.
When writing, the RUNE token trades at $1.17 with an intraday gain of 1.57% showing bullish indications. Moreover, the pair of RUNE/BTC is at 0.0000432 BTC, and the intraday trading volume increased by 4.70% to $18.61 million. The day high of RUNE is $1.177, and the daily low is $1.156, which means the price is traded in a narrow range and has no decisive moves. The market cap of RUNE is $353.29 Million.
Will RUNE gains momentum above 20 day EMA?
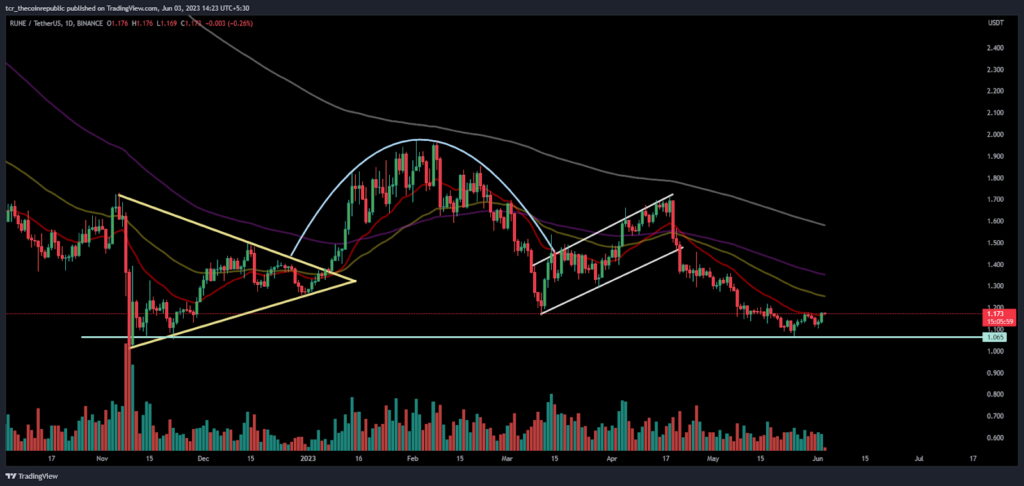
On the daily charts, the RUNE token formed a rounding top formation and showed a drop in the price, and a fresh downtrend was also noted after the breakdown of the neckline near $1.50.
Moreover, the chart shows a range-bound move of token and not attaining the interests of investors due to the low volumes and token hovering in the congestion zone.
What does RUNE suggest on a 4 hour chart?
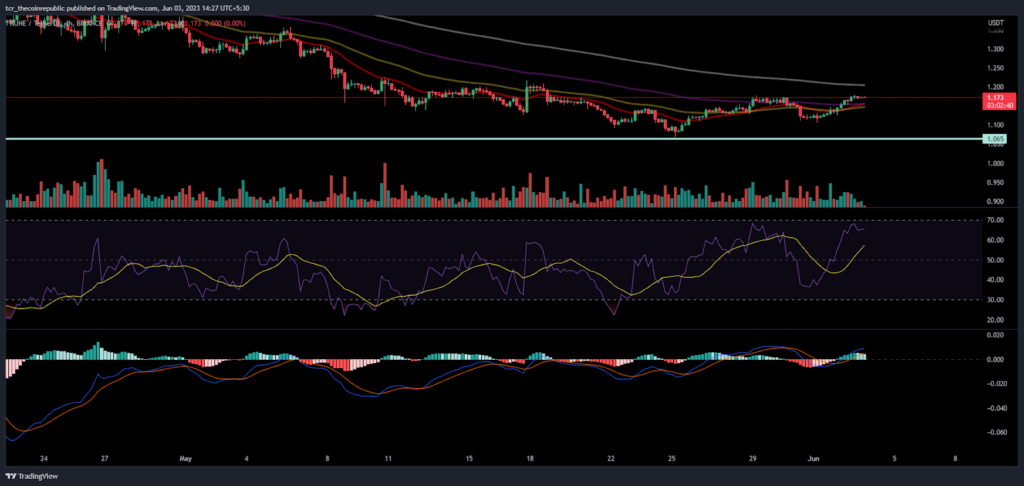
On the 4-hour charts, RUNE token have spent more than a week near the support and demand zone but stay within the range. Although the token forms a double bottom pattern, it cannot break the neckline of $1.20, which, if it breaks, then a bounce can be seen.
The RSI goes near the overbought zone and shows a positive crossover on the index curve.
Furthermore, it says the positive outlook on the charts for future sessions.
The MACD indicator shows a bullish crossover, and the green bars on the histogram show that buyers are gaining momentum from the last session and are willing to sustain above the 20-day EMA.
Conclusion:
RUNE token is looking for a bounce above the 20-day EMA near $1.20 in the upcoming sessions.
Technical levels –
Support –$1.000
Resistance – $1.500
Disclaimer
The views and opinions stated by the author, or any people named in this article, are for informational purposes only, and they do not establish financial, investment, or other advice. Investing in or trading crypto assets comes with a risk of financial loss.