
 streamoors
 IGNITION
 Injective
 Pearl
Pearl NEAR Protocol
 Quantus
 Aerodrome Finance
- ZEC/USDT briefly breached its daily support at $25.32 and has bounced back after creating a low
- ZEC/USDT briefly created a low at $21 and has taken a bounce of 17.20%
ZEC got a strong bounce back from the level of $21 and is currently trading at its daily support level of $25.32 after breaching it. The market has witnessed aggressive selling ever since the price broke the daily support of $32 in March. The price is trading at a crucial level and if it faces a rejection now, it can witness further downfall to $21 and $17 levels.
The daily chart shows the price creating a new low
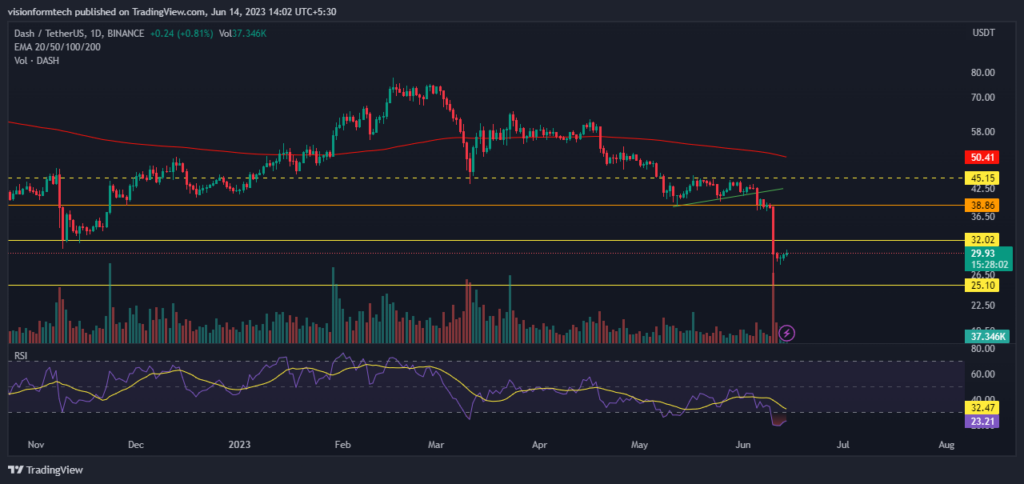
The Daily time frame shows Bear domination since the beginning of the year as the price could not breach the resistance of $50.This created an opportunity for the bears and gave them the confidence to push down the price further, which resulted in increased selling pressure where the bulls could not defend major support levels.
The Overall market sentiment is bearish and the buyers are struggling to keep up with the falling prices. On the other side some investors are looking at this as a potential opportunity to buy due to cheap prices. The bounce with high volume suggests that price is a point of high interest for the market players. The Bulls are showing up to defend the lower levels.
Short Term Chart shows a bounce with volume
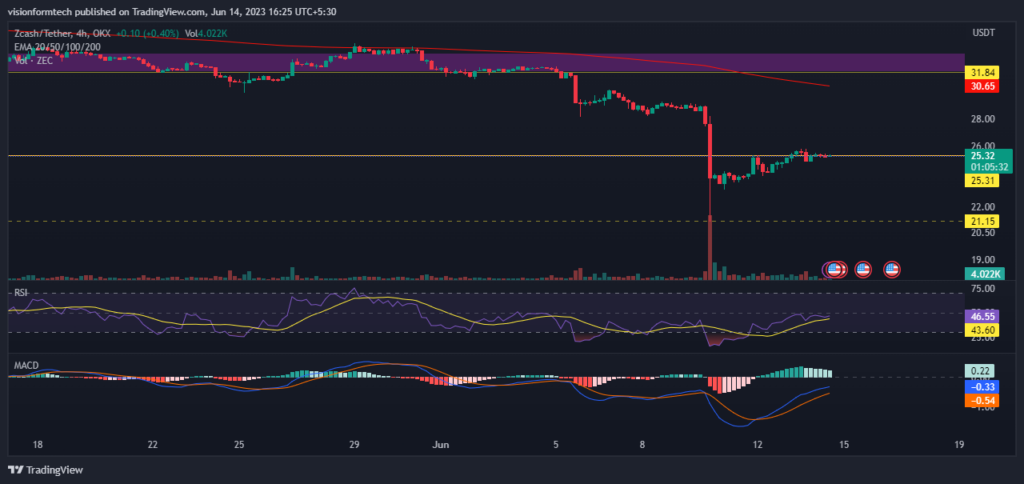
In the Shorter Time frame, ZCASH is trying to claim back its support which is evident by the bounce. However, with all the technical indicators showing a downtrend, it is important to note that the market sentiments are still bearish. The Volume briefly increased which suggested a high level of participation of both the buyers and sellers. The current level must be closely observed and investors should wait and notice for rejection or reversal.
Following the recent volatile moves, the market could be looking at some sort of consolidation as the sellers would be interested in taking profits and buyers might start accumulation.
RSI: The RSI indicator is currently at 46.55 which indicates that the strength is low in the market and the bears are in control.
MACD: The MACD indicator has made a Crossover however the MACD is still below the 0 line which indicates bearish momentum.
200 EMA: As it is observed on the 4hr, the price is trading below the 200 EMA(exponential moving average) which acts as a significant resistance. This is a clear indication of a downtrend where the sellers are in control and for a trend reversal, the price must break and trade above the 200 EMA.
Technical levels
Support Levels: $21.15
Resistance Levels:$31.84
Conclusion
The Price Action indicates that ZCASH is trading in a downtrend, Although a recent bounce is indicating the diminishing strength of the sellers and suggest that the bulls might be buying into this dip. Investors must closely observe the current levels for any indication of bounce or rejection towards the side because in a downtrend this bounce could just be a natural pullback.
Disclaimer
The views and opinions stated by the author, or any people named in this article, are for informational purposes only and do not establish financial, investment, or other advice. Investing in or trading crypto assets comes with a risk of financial loss.




