
 Quack AI
 Pudgy Penguins
 Starknet
 Pearl
Pearl Sui
Sui Celestia
 Quantus
- DYDX token is slipping below significant moving averages.
- Bulls sleeping below 20 day EMA peeking bearish signs.
DYDX token shows bearish cues and trading below 20 day EMA indicating weakness and fresh downtrend in the last trading sessions.
The ongoing price action shows that, token has retested the mark of $1.350 and rebounded from there forming a hammer candlestick on the bottom shows signs of reversal.Furthermore, token peeks to attain 20 day EMA mark to catch and indicating that bulls are rescuing the gains and stretching the muscles.
Moreover, a bounce in token price and a pullback shows the intent of bulls and can create a trap for sellers which could lead to extending the rally in the next sessions.
When writing, the DYDX token is trading at $1.65 with a massive intraday gain of 6.64% showing rebound from bulls. Moreover, the intraday trading volume also jumped by 14.95%.
Daily Chart formation of DYDX
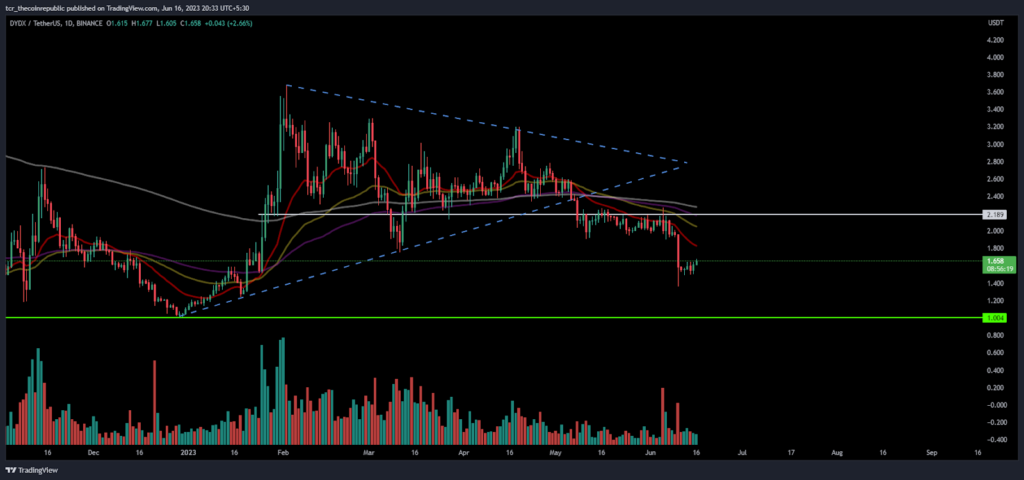
On the daily chart, DYDX token faced rejection and broke the lower trendline of the symmetrical triangle pattern and slipped below the support. Moreover, price is traded below the key moving averages.
After the breakdown of the symmetrical triangle pattern, the token shows decline below the key mark of $1.500 and sellers were made short positions leading to the fall DYDX can gain traction if follow-on buying action will extend toward the 20 day EMA mark near $1.80.
As per the Fib level, DYDX token is trading near the 23.6% level and willing to sustain above the mark above $1.40 to gain traction. The trajectory move shows that if DYDX further gains, then the resistance mark of $1.60, will react as an immediate resistance mark and follow on till $1.80. On the other hand, if the token starts to fall, then $1.20 will act as a strong support mark.
Short Term Charts Of DYDX
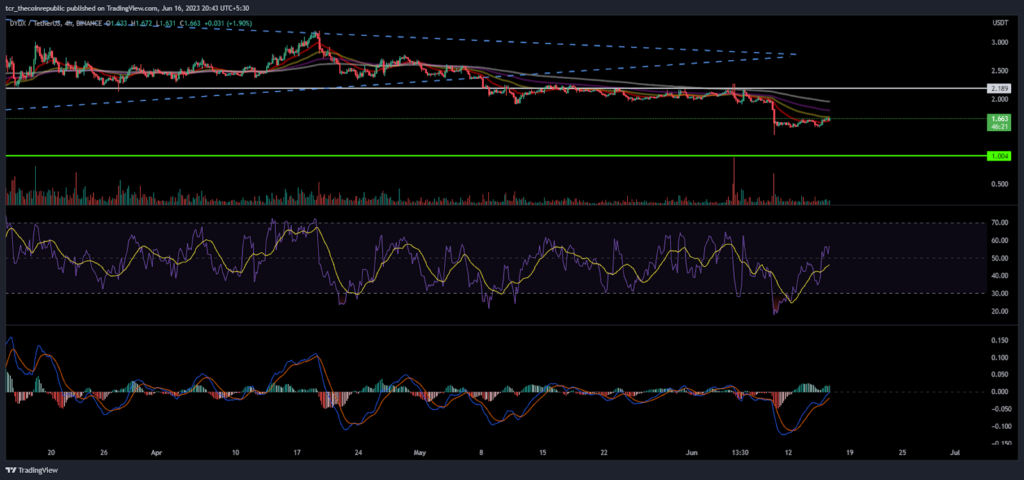
On the 4-hour charts, the DYDX token is willing to attain a 20-day EMA but due to the ongoing downtrend bulls are unable to extend the momentum and stay near $1.30.
However, the sellers are also being active on the token and trying to break the voyage further and additional selling can be extended, if the token breaks the low of the previous candle below $1.30.
The RSI showed a sharp reversal from the oversold region and a positive crossover also noted which shows a bullish view in the upcoming sessions.
The MACD indicator shows a beginning of green bars and also showed bullish crossover which shows an upcoming bullish perspective.
Conclusion:
DYDX token noted a reversal and trying to attain a 20 day EMA based on the ongoing momentum from the demand zone.
Technical Levels:
Support Levels: $1.40
Resistance Level: $2.00
Disclaimer
The views and opinions stated by the author, or any people named in this article, are for informational purposes only and do not establish financial, investment, or other advice. Investing in or trading crypto assets comes with a risk of financial loss.




