
 astronaut
 Pearl
Pearl Hyperliquid
 Walrus
 Pudgy Penguins
 Bitcoin
 NEAR Protocol
- BSV is currently trading at $25.30 with a dip of -1.93% in the 24 hours.
- BSV’s live market cap is $485095184.
- BSV faced a massive decline of -18.50% in the last 7 days.
Introduction
A fork of Bitcoin Cash (BHC) create Bitcoin SV. BSV was introduced to replace the original Bitcoin protocol as defined by version 0.1 of Bitcoin. Bitcoin SV objectives to fulfill the original version of Bitcoin. It was in the Satoshi Nakamoto white paper. It aims to provide scalability and stability in line with the original description of Bitcoin as an electronic cash system. The full form of SV in Bitcoin SV is “Satoshi Vision”.
Trend Analysis
By studying historical price data, we can say that BSV is right now in a downtrend. The price is declined -18.50% in the last seven days and we can say that BSV is underperforming right now.
BSV Price Analysis
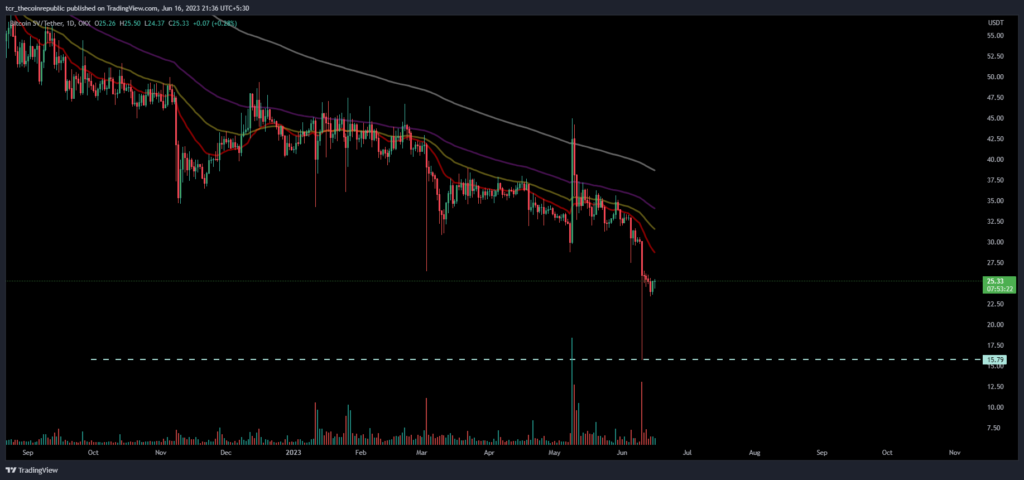
On the daily charts, BSV shows a long legged doji candlestick and a pullback from the strong demand zone of $15.00, where a bounce was noted which shows the intent of buyers who are trying to rescue the gains.
EMA: BSV Price is currently trading below the 200-day EMA and 50-day EMA on the daily time frame, which is a negative sign. Investors’ sentiments regarding BSV are negative and are on the selling side.
MACD: The Indicator MACD is giving bearish signals . The MACD line at -2.17739 and signal line at -1.49780 are below the zero line, suggesting the MACD is in negative territory and giving bearish signals.
RSI: The current value of RSI is 27.38 points and the 14 SMA line is currently below the median line around 37.49 points which shows bearish sentiment in the market. The 14 Day SMA line in RSI is beneath the median and indicates an adverse trend. Their is bearish sentiment in the market as the price is currently at an oversold area.
Stochastic RSI: In the stochastic RSI, the %d line is at 0.16 . The %k line is at 0.49 points. The %d line indicates that RSI is in the overbought area. The percentage k line shows negative sentiments regarding the price.
Volume Analysis: BSV trading volume of 24 hours is $7552002.28.
Conclusion
BSV’s price presently shows a pessimistic scenario according to the near future. Major reliable indicators like EMA, RSI, and MACD are giving negative signals about the BSV coin, and Investors also not showing any big buying interest this could be happening because the coin is performing bad from long time.
Technical levels-
Support – The current support level of BSV is $20.185.
Resistance –The current Resistance level of the BSV is $36.972.
Disclaimer
The particular analysis is provided for informational purposes only. It should not be taken as financial, Investment, or any other advice. Investing in or Trading Crypto assets comes with a risk of financial loss. Please consider your circumstances and risk profile before making any investment decisions.




