
 no crying in the casino
 NEAR Protocol
 Starknet
 Pyth Network
 Pearl
Pearl Quantus
 Pudgy Penguins
- MAGIC/USDT is down 2.77% from yesterday
- MAGIC is trading in a downward channel while creating lower lows
MAGIC has been trading in a bearish price action for the past few months. It recently broke the daily support at $0.8017 and saw a big dump of 24% before bouncing back to the current price of $0.6486
MAGIC/USDT is trading at $0.6487 after it saw a dump from its daily support. The selling pressure pushed the price to 0.6061 which came near to its primary support.
One of the reasons for this downtrend is the fact that the price was unable to breach the resistance of 1.0278. After multiple attempts, the price saw rejection with the formation of a double and this created a further selling pressure. Post that the bulls also failed to defend the support level of 0.8017 which was followed by a sharp decline.
Daily chart show price moving in a channel
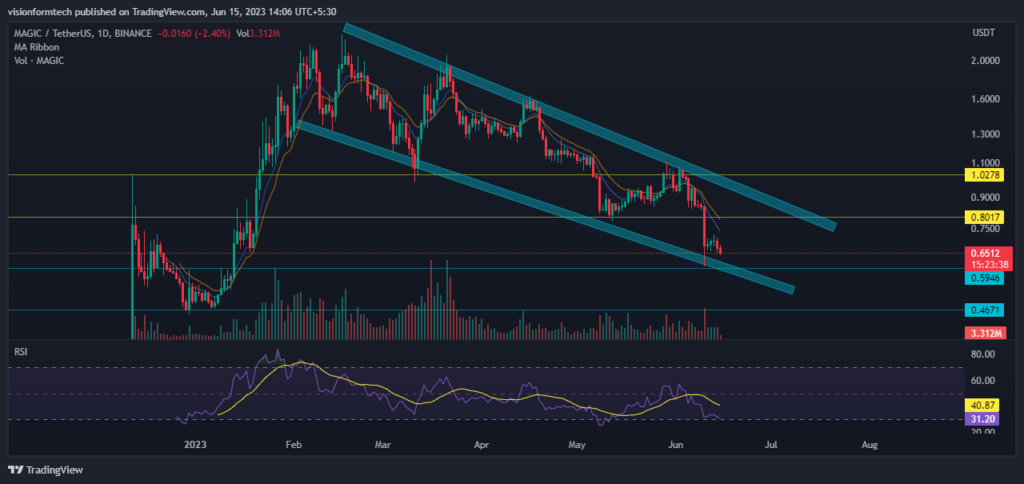
As per the price action on the Daily Chart, the price is moving in a descending channel which represents that the bears are in control, and selling is observed as soon as the price reaches the trendline of this channel. RSI is showing the formation of a divergence. If you observe closely the price is creating a lower low and the RSI is still above its previous low, This is an indication that sellers are losing strength.
Although the trend is bearish, Investors should closely watch the upper trendline of the channel which is acting as a resistance. If the price breaks above the resistance there is a potential for a big rally which is targeted at the All-time high of 2.2$ which is almost 150% from the trendline.
The Short Term Chart is representing a sideways condition
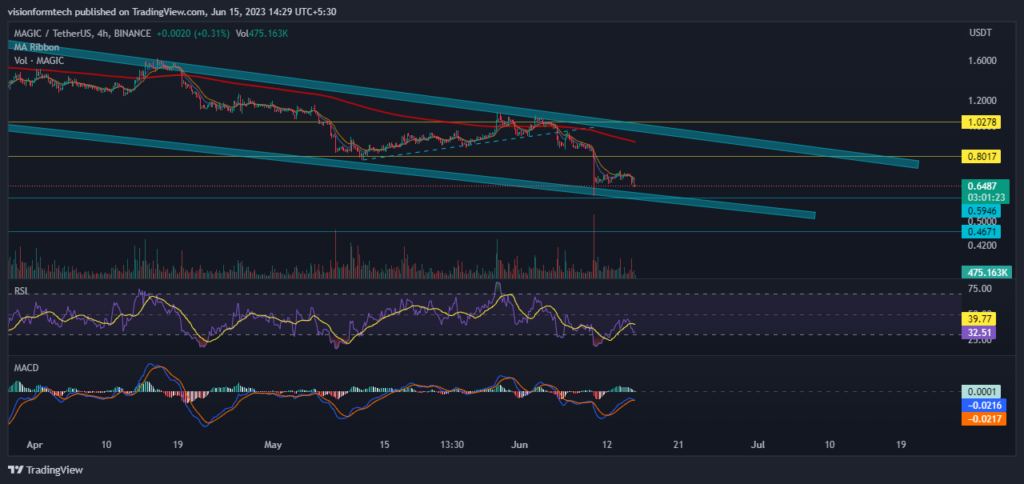
The 4H Chart is showing that the price is testing the lower trendline of the channel along with a bounce from its daily support. This bounce was minor and this indicates that aggressive buying is still missing. If the price falls below the support, there is a probability that we can see a decline of 19.54% before finding support at $0.4671.This level is very crucial for the future of the price.
RSI: The RSI indicator is currently at 32.55 and the RSI has crossed the MA line towards the downside which is indicating that bears are controlling the market.
MACD: The MACD indicator briefly made a bullish crossover but is already losing momentum and is about to cross in the downward direction. MACD is below the zero line
200 EMA: As it is observed, on the 4hr, the price is trading below the 200 EMA(exponential moving average) which acts as a significant resistance. This is a clear indication of a downtrend where the sellers are in control and in order for a trend reversal, the price must break and trade above the 200 EMA.
Conclusion
MAGIC is currently being dominated by the bears as the prices are dipping lower. The price is moving in a downward channel. This channel could be the key to the reversal of trends. Until that the investors must closely watch the current price levels. This is a very crucial time for MAGIC as the upcoming will decide whether the asset will be a hero or zero. This also creates interest for investors as the prices are available at good discounts.
Technical levels
Support Levels:
$0.5946 – Support 1
$0.4671 – Support 2
Current Price: $0.6476
Resistance Levels:
$0.8017 – Resistance 1
$0.8017 – Resistance 2
Disclaimer
The Current analysis is given for informational purposes only .This information should not be considered as financial, Investment, or other advice. Investing in or Trading Crypto assets comes with a risk of financial loss. Please consider your circumstances and risk profile before making any investment decisions.




