
 OnlyAgent
 Aerodrome Finance
 Axis Robotics
 Monero
 Lighter
 Pearl
Pearl Bitcoin
- XEM is currently trading at $0.02551589 with a dip of -4.63% in the last 24 hours.
- XEM’s live market cap is $230655375.
- XEM faced a massive decline of -11.19% in the last 7 days.
Trend Analysis
By studying historical price data, we can say that XEM is in a downtrend currently. The price has declined -11.85% in the last seven days and we can say that XEM is underperforming right now. From its peak price of $1.87, it fell 98.63% in the last five years and destroyed the investors’ wealth. As we know, the current market sentiments are not good and there is no big volume and buyers available in the current market condition. This could be a reason for the underperformance of the coin.
NEM (XEM) Price Analysis
EMA: XEM price is currently trading below the 200-day EMA and 50-day EMA on the daily time frame, which is a negative sign. Investors’ sentiments regarding XEM are negative and are on the selling side.
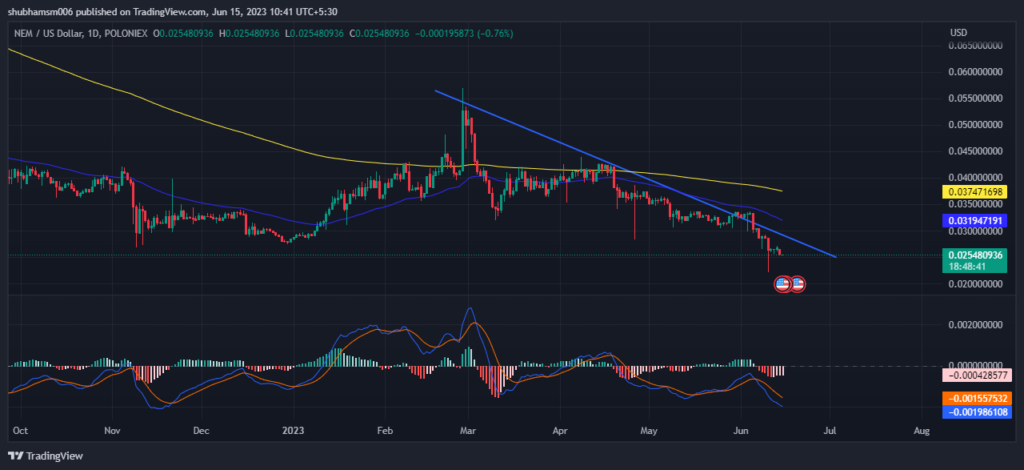
MACD: The indicator moving average convergence divergence is also on the bearish side. It gives a negative signal. The MACD line at -0.001986108 and signal line at -0.001557532 are below the zero line. This in turn suggests the MACD is in negative territory and is giving bearish signals.
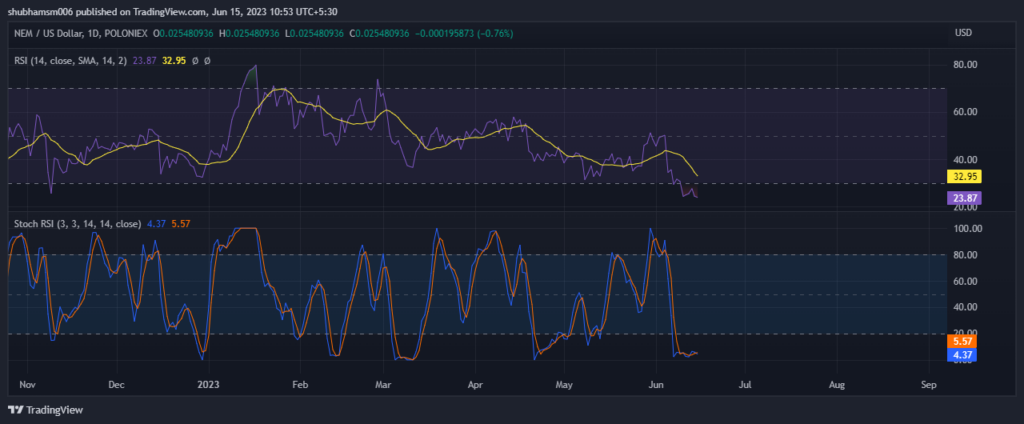
RSI: The current value of RSI is 23.87 points and the 14 SMA line is currently below the median line around 32.95 points which shows bearish sentiment in the market. The 14-day SMA line is under the median. It indicates a negative sign or bearish sentiment in the market as the price is currently at an oversold area.
Stochastic RSI: In the stochastic RSI, the %d line is at 5.57 and the %k line is at 24.37 points. The percentage d line shows that RSI is in the overbought area. The k percentage line shows negative sentiments regarding the price.
Volume Analysis: NEM (XEM) trading volume of 24 hours is $6894436 with a 12.10% increase in volume in the last 24 hours. Currently, the volume is low because of adverse market conditions and a lack of buyers in the market.
Technical levels-
Support – The current support level of XEM is $0.0237.
Resistance –The current Resistance level of the XEM is $0.036.
Conclusion
XEM’s price presently shows a pessimistic scenario in the near future. Major reliable indicators like EMA, RSI, and MACD are giving negative signals about the XEM coin. Investors are also not showing any big buying interest and this could be happening because of the consistent negative performance of the coin. If the coin breaks the current level then the chances of the coin falling further may also increase.
Disclaimer
The analysis given above is for informational and educational purposes only. You should not be taken it as financial, investment, or any other advice. Investing in or trading crypto assets is risky. Please consider your circumstances and risk profile before making any investment decisions.




