
 Dacity Coin
 Injective
 Celestia
 Quantus
 Pearl
Pearl Pudgy Penguins
 Bittensor
- ZIL is underperforming and continues to fall from the past sessions.
- Buyers unable to hold the pressure and losing momentum.
ZIL coin is showing a decremental move and continues to slip from the past trading sessions losing strength. Moreover, due to the low volumes buyers could not attain the grip and sellers took advantage of making short positions resulting in the downmove of the coin. Furthermore, ZIL coin indicates weak chart structure and penetrates for an up move, but mighty bears gained momentum and forced back the bulls.
Recently, ZIL showed a breakdown below the lower neckline of the rising wedge pattern, and sellers aggressively made short positions and sunk the price below the 20-day EMA. Furthermore, further follow on selling came when it broke the lower trendline near $0.02600, where intense selling was noted on the charts.
When writing, ZIL coin trades at $0.01780 with an intraday gain of 4.48% showing a revival near support. Moreover, the pair of ZIL/BTC is at 0.000000670, and the intraday trading volume increased by 4.40% to $13.22 Million. Furthermore, the intraday high of ZIL is $0.01788, and the low is $0.01671. The coin showed underperformance in the last couple of trading sessions with lower trading volumes.
Daily Charts Shows Bearishness
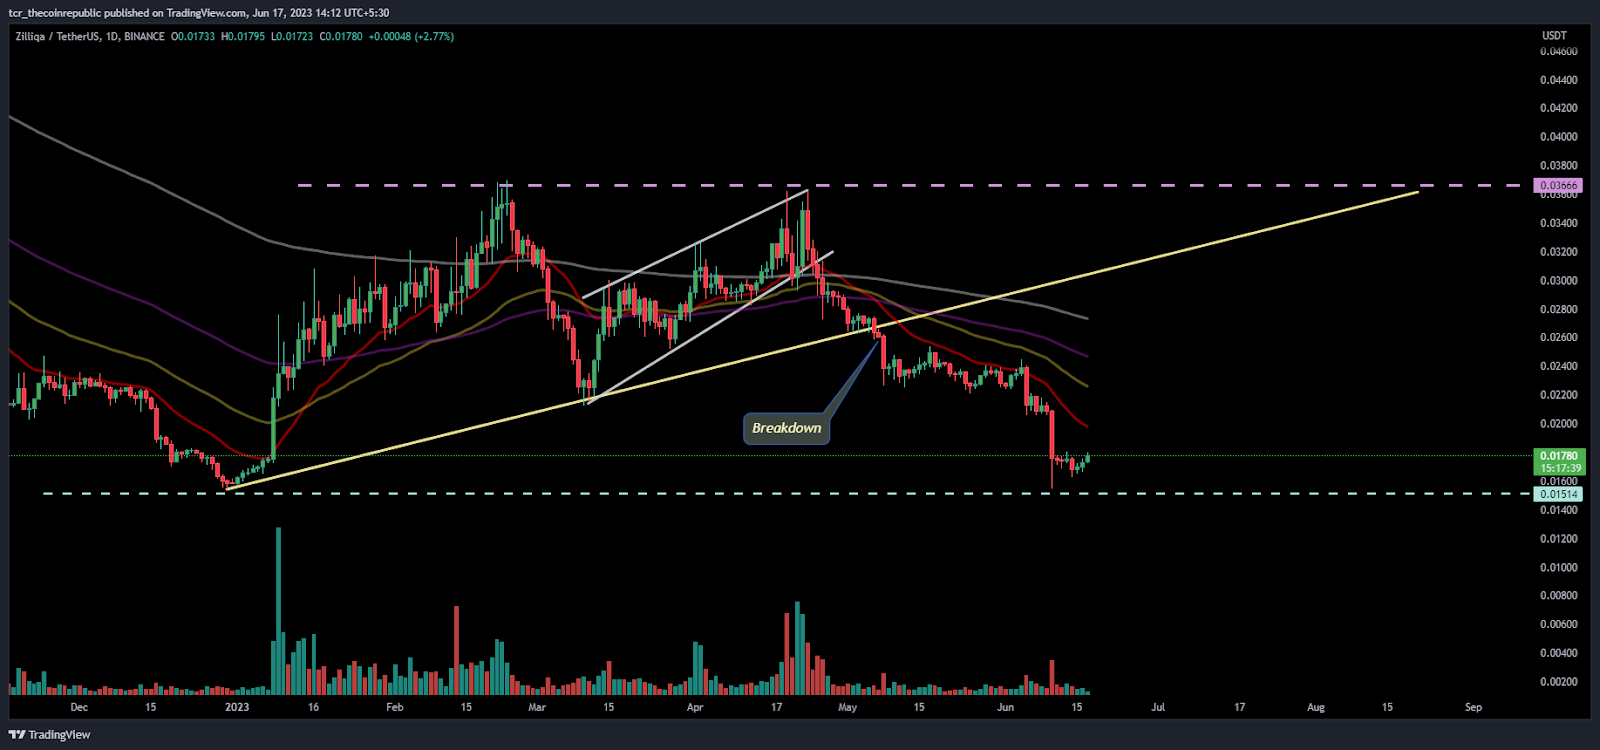
On the daily charts, ZIL coin shows a bearish outlook and underperformed from the last trading sessions. After the breakdown below the lower trendline, ZIL coin continued to sink and stayed under the hands of bears. Moreover, the price action shows that the coin is near to the demand zone and bulls are continuing to struggle and trying to accumulate the coin.
Furthermore, the ZIL coin retested the strong support mark of $0.01500 in the recent trading sessions and held the breath for a while. Moreover, the trajectory shows that if the ZIL price starts to fall again, then a massive decline can be witnessed in the next sessions.
The ongoing price action shows that bearish candles were being formed on the charts and sellers showed their dominance which suggests a downtrend of the coin .Although, the coin is near to the demand zone and a bounce can also be seen if buyers succeed to accumulate the coin in the next sessions. ZIL is near to the oversold region and a bounce from the lower Bollinger band may happen if volume is attained by bulls.
What Traditional Indicator Says?
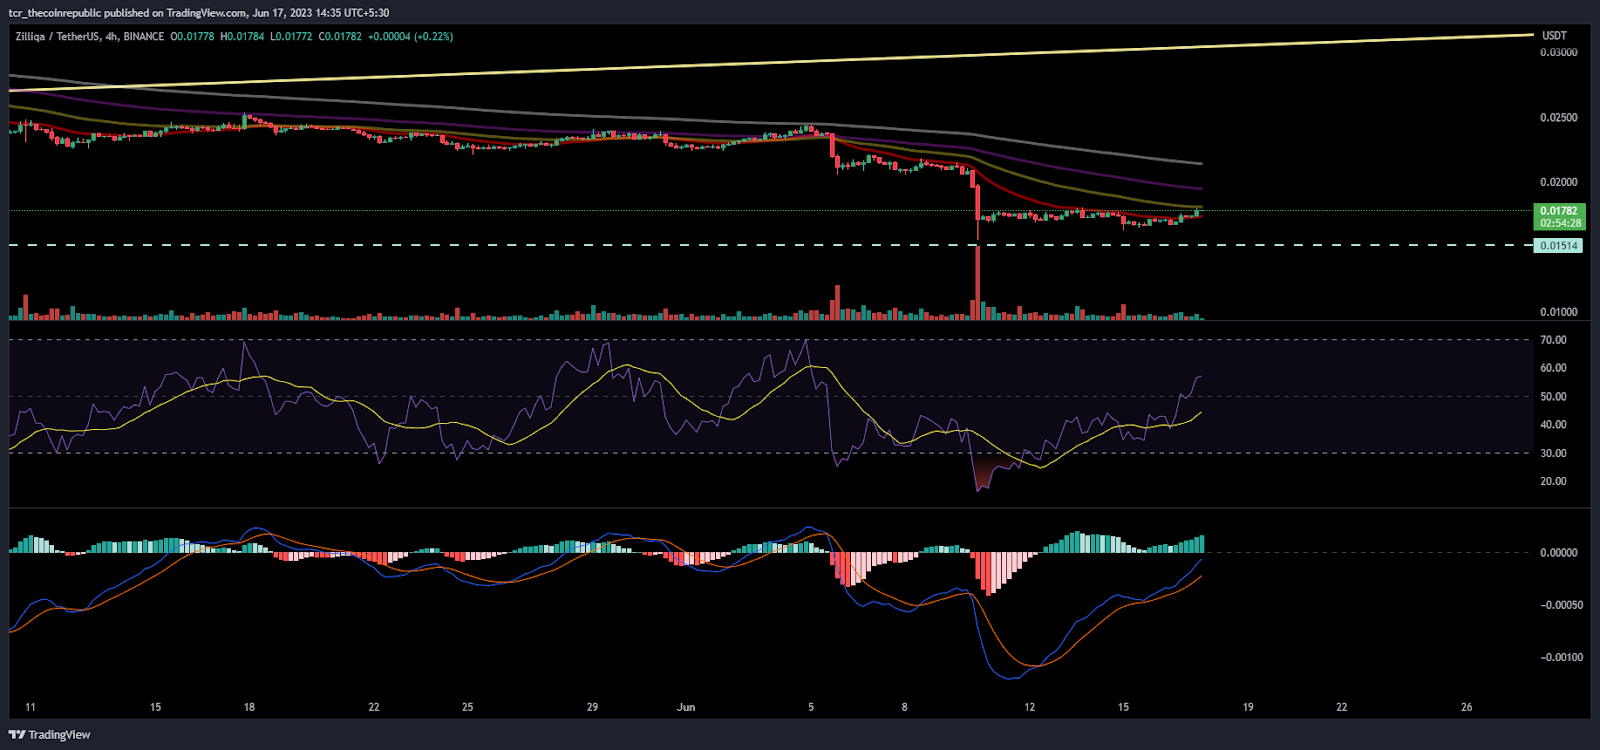
On the 4-hour charts, ZIL showed a sharp bounce near the demand zone of $0.01500 and was willing to escape the sellers region. However, sellers maintained grip near the mark of $0.01800 with bulls heading up.
The RSI showed a bounce from the oversold region and showed a positive crossover in the last trading sessions.
The MACD indicator began to plot green bars on the histogram and show reversal indications with bullishness.
Conclusion:
ZIL coin is struggling near the demand zone of $0.01500, where it tangles in the past trading sessions.
Technical levels
Support levels: $0.01520
Resistance levels: $0.02000
Disclaimer
The views and opinions stated by the author, or any people named in this article, are for informational purposes only. They do not establish financial, investment, or other advice. Investing in or trading crypto assets comes with a risk of financial loss.




