
 streamoors
 IGNITION
 Quantus
 Sui
Sui Pearl
Pearl Zcash
Zcash Aerodrome Finance
- 1 The price of BAT is trading close to $0.170952. The coin’s price increased by 4.40% in the last 24 hours.
- 2 The BAT price is observing a decline of -13.06% in the last 7 days.
- 3 The BATmarket capital is at $254612056.
Trend Evaluation
By evaluating the previous price data, we can say that BAT is in a downtrend currently. The price decreased by -13.06% last seven days and we can say that BAT is underperforming right now. From its peak price of $1.90, it fell -91.00% in the last 1 year and destroyed the investors’ wealth. As we know, the current market sentiments are not good and there is no big volume or even buyers available in the current market condition.This could be a reason for the poor performance of the coin.
BAT Price Analysis
EMA: The price of BAT presently is trading beneath 50 and 200 EMA which suggests the price is in a downward trend. If the sellers continue to push the price downwards, it could fall more in value in the upcoming week if the current support will be destroyed by the sellers.
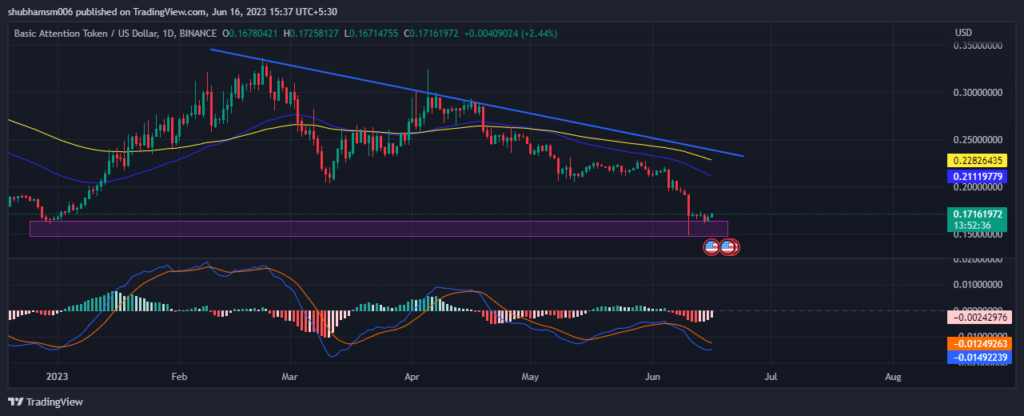
MACD: Right now, MACD is giving bearish views. The MACD line is at -0.01492239 and the signal line is at -0.01249263. Both are on the negative side, giving bearish signals and are below the zero line.
RSI: The RSI line has been moving in the oversold territory for the past few days. The 14 SMA has a value of 30.50 points and the RSI line is around 29.72. This indicates that the BAT market is in the oversold zone.
Stochastic RSI: The current %d line is at 7.67 and the %k line is at 16.46 which indicates BAT is in an oversold zone.
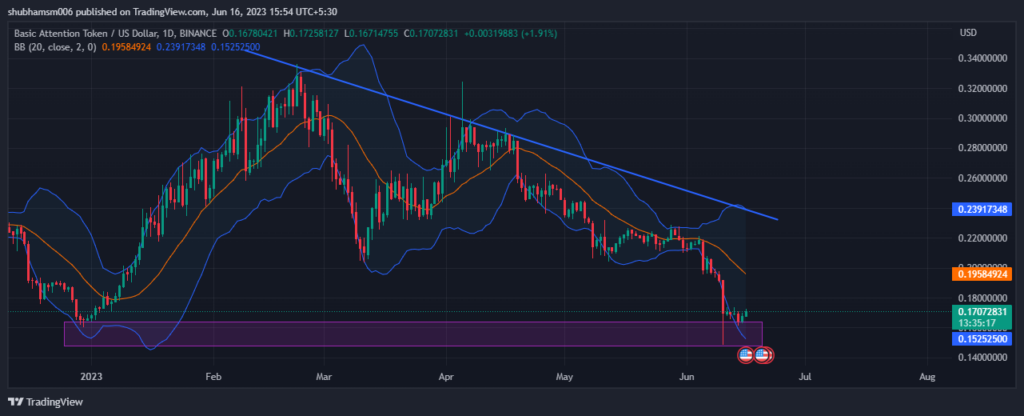
Bollinger Band: The Bollinger Band showing a bearish signal. The price is resting on the lower band.
Trendline Analysis:
As per the Trendline, it seems that the price is respecting the Trendline. For now, it’s getting support from the trendline and can go upward to the resistance line more shortly. But shortly, it appears to be bearish. So, the price of BAT can continue to fall and try to break the current support.
Volume Analysis: BAT trading volume of 24 hours is $12491046 with a 1.90% increase in volume in the last 24 hours. Currently, the volume is low because of adverse market conditions and due to a lack of buyers in the market. Buyers are not confident about the market anymore.
Technical Levels:
- Support – The current support level of BAT is $0.154.
- Resistance –The current Resistance level of ROSE is BAT $0.239.
Conclusion
According to the analysis, the indicators indicate a bearish signal. The price is under the control of bears, and it is expected to fall more in the near future.
BAT’s price presently shows a pessimistic scenario. Major reliable indicators like EMA, RSI, and MACD are giving negative signals about the BAT coin. Investors are also not showing any significant buying interest and this could be happening because of the consistently poor performance of the coin. If the coin breaks the current level, then the chances of the coin falling further may also increase.
Disclaimer
The analysis given above is for informational and educational purposes only. You should not be taken it as financial, investment, or any other trading advice. Investing in or trading crypto assets is risky. Please consider your circumstances and risk profile before making any investment decisions.




