
 Injective
 Pudgy Penguins
 Quantus
 Bitcoin
 Celestia
 Sui
Sui Derive
PAXG, the asset-backed token, is moving in a price action that is similar to Gold. At present the price has taken a retracement right after creating a swing high in the last month.
PAXG/USDT is trading at $1932 after getting a retracement of almost 6%, This downfall looks like a natural pullback in a trending market. The overall trend is bullish for now as the price is above the Daily 200 EMA. The decline in price came right after it saw a rejection from the daily resistance level of $2057. This resistance is very strong as, even after multiple attempts, bulls have failed to close a Daily candle above this level.
The Daily chart shows a pullback after the Bull run
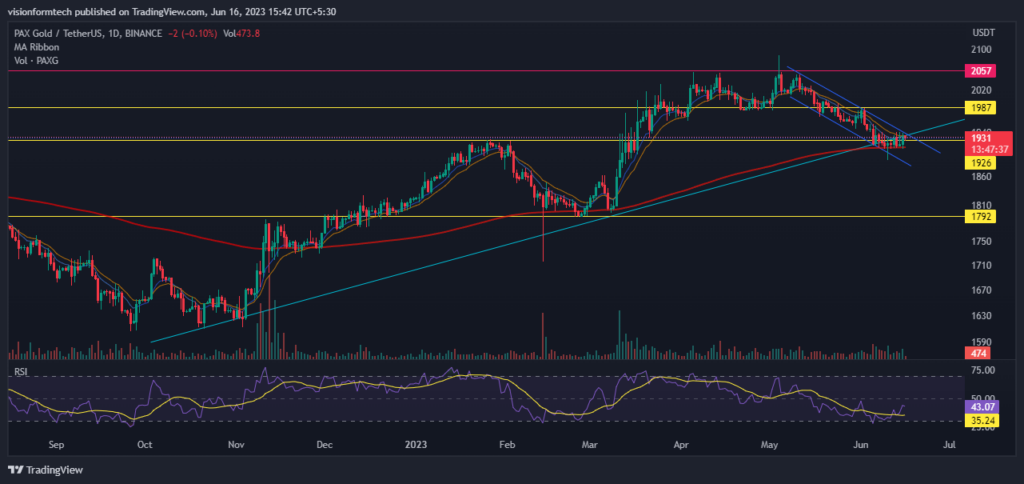
As we can see from the daily time frame, PAXG has been in an uptrend since November 2022. The price is getting support on the trendline for the past 6 months. This makes it a significant level of support. At present the price consolidates around the trendline. It looks like there is an intense fight between the bears and the bulls where the market will be deciding its direction very soon.
As long as the price holds above 200 EMA, investors will stay relaxed and look for a potential upside. A panic situation will be induced if the price closes below the 200 EMA which will also mark the breakdown of the trendline.
The 4H chart represents a minor downtrend
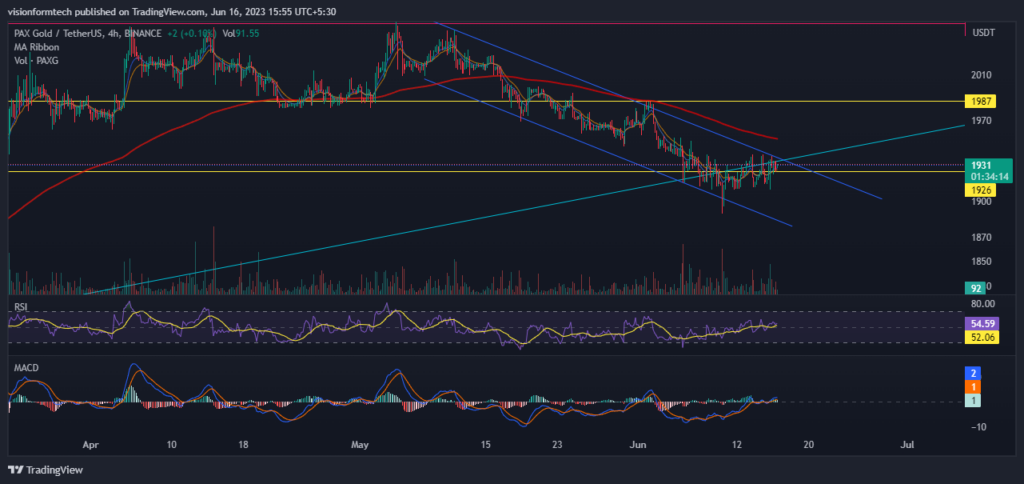
The 4H timeframe is showcasing a minor downtrend along with the formation of a downward channel. As the price is trading on the trendline, bulls are trying very hard to defend it as a breakdown can cause a massive fall. Bulls are keeping a watch over this downward channel. This could be a key to the reversal and a breakout can potentially start the next Bull run.
In case of the breakdown of the long-term trendline, we can expect a fall of at least 7%. Such a fall can change the market trend turning it bearish.
RSI: The RSI indicator is currently at 55.34 and the RSI has crossed the MA line towards the upside. This can indicate a slightly bullish or sideways momentum.
MACD: The MACD indicator made a bullish crossover suggesting the bears are taking a break. The Signal Line and the MACD Line are very close to each other representing sideways conditions and volatility can be expected very soon.
200 EMA: As it is observed, on the 4hr, the price is trading below the 200 EMA(exponential moving average) which acts as a significant resistance. This is a clear indication of a downtrend where the sellers are in control and for a trend reversal, the price must break and trade above the 200 EMA.
Technical levels
Support Levels: $1803
Current Price: $1935
Resistance Levels: $1987 – Resistance 1
$2057 – Resistance 2
Conclusion
PAXGOLD can be seen retracing after creating a swing. Price has taken a dump after rejecting its strong resistance until now. The token price is now resting on a major trendline which is a significant support and the market is waiting for the decision. A reversal back can potentially create a new all-time high. However, a Breakdown of this trendline will mark the beginning of a bear market.
Disclaimer
The above analysis is provided for informational purposes only and should not be considered as financial, Investment, or other trading advice. Investing in or trading Crypto assets comes with a risk of financial loss. Please consider your own circumstances and risk profile before making any investment decisions.




