
 Celestia
 Pearl
Pearl Quantus
 Zcash
Zcash Hyperliquid
 Injective
 NEAR Protocol
- APT Price surges 11% and buyers succeed to defend the $6.00 demand zone.
- Aptos Price showed initial signs of bullish trend reversal.
- The Aptos crypto price trading below the 50 day EMA shows the short term trend is down.
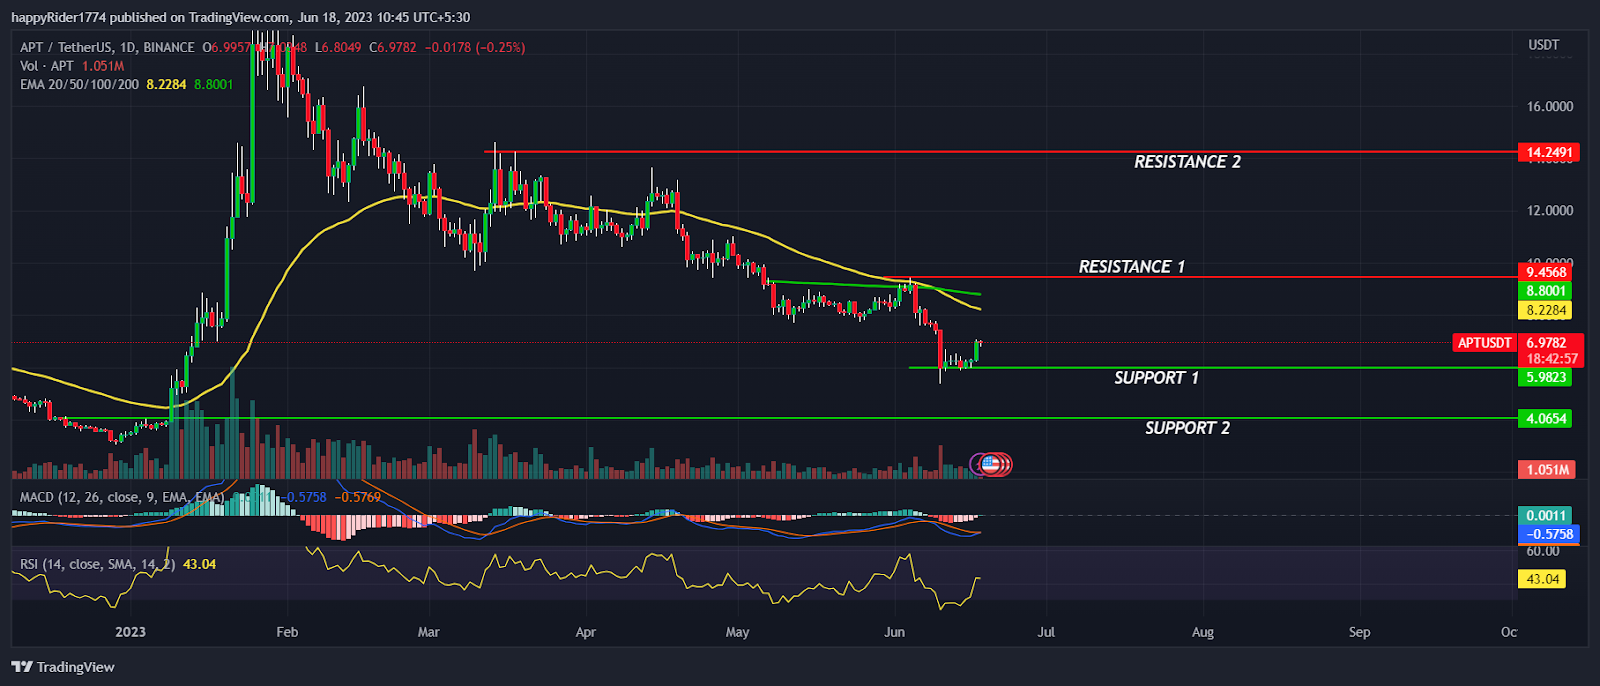
Aptos Price surges 11% and showed initial signs of bullish trend reversal. Buyers succeeded to defend the $6.00 support and formed a bullish candle. However, the confirmation of the bullish trend reversal is still awaited.
From the past couple of months, Aptos price is continuously declining by forming lower low swings and eroded the 90% of the previous gains.
The short term pull back is not sustaining on the higher levels and resistance is also shifting down. It shows the sellers dominance in the supply zone. The recent pull back in APT Price looks reliable but until it breakout of $9.00 the possibility of getting rejection is high.
APT price is below the 50 and 200 day EMA which will act as an immediate hurdle for bulls. Therefore, the confirmation of trend reversal will come when buyers are able to push the price above both the EMA.
Aptos Price is trading at $6.9782 with an intraday intraday decline of -0.25%. The 24 hour volume to market cap is 19.06%. The APT/BTC pair is trading at 0.00026541 with an intraday rise of 0.48%.
The price of Aptos with a BTC pair is also near to the demand zone and buyers are trying to rebound.
Will Aptos Price continue to recover?
Aptos Price has not performed well in the past few months and disappointed the expectation of the long term investors.
However, APT Price seems to be oversold and the downfall is taking halt near to the crucial support. Therefore, if buyers are able to keep the price above $7.00 we may expect the recovery to continue for a few weeks.
However, the price will pick above the momentum only above $9.00 else, it is expected to remain in consolidation.
On the other hand, If APT price fails to give up the momentum and drops below $7.00 then crucial support will be at risk. The technical analysis suggests, the recent up-move in APT price looks sustainable and more up-move is possible.
APT Price on weekly time frame
APT Price fell 31% in the previous week and attempted to break $6.00 support. But luckily the prices did not get the follow down momentum shows responsive buyers are active.
The MACD curve is also reversing upward and might generate a positive crossover. It indicates bullishness and buyers seem to be returning back to the track. The RSI at 44 slopes upward denotes price is recovering from oversold territory and may reach the neutral zone.
Conclusion
Aptos Price surges 11% and showed signs of bullish trend reversal but the confirmation is still awaited. However, The APT price is at crucial support and bears seem to be losing the momentum.
The technical analysis suggests, The recent up-move looks reliable and prices are expected to continue the recovery.
Technical levels
Resistance levels: $10.00 and $14.00
Support levels: $5.00 and $4.00
Disclaimer
The views and opinions stated by the author, or any people named in this article, are for informational purposes only. They do not establish financial, investment, or other advice. Investing in or trading crypto assets comes with a risk of financial loss.




