
 Injective
 Bitcoin
 Quantus
 Sui
Sui Derive
 Pump.fun
 Quant
Quant
- RNDR token showing a hammer candle on the bottom.
- Bulls reshaped the muscles looking strong in the last trading sessions.
Render Token is regaining the shine and bounced from the support range near $1.700 gaining fresh momentum. Moreover, a hammer candlestick formed on the base which shows that bulls are accumulating the token and engulfing the pressure of sellers now. However, the token is facing resistance on the 50 day EMA and 100 day EMA. If token succeeds to surpass, then enormous gains can be seen and further upside towards the trajectory till $2.500 will be there in the upcoming sessions.
Moreover, the RNDR token has maintained the gains and trading above the 200 day EMA which shows that the token is still above the neutrality and looking to retested the highs and attaining strength.
However, the token has ended the corrective phase and begun the reversal ride as shown on the charts in the last trading sessions.
When writing, the RNDR token is trading at $2.02 with an intraday gain of 1.13% showing buyers’ attachment and sellers looking trapped. Moreover, the trading volume shows a massive increase of 11% at $108.69 million leading to a huge addition of open interest from buyers. The market cap of RNDR is $1.07 Billion.
Daily Charts Shows Bulls Regaining the Potential
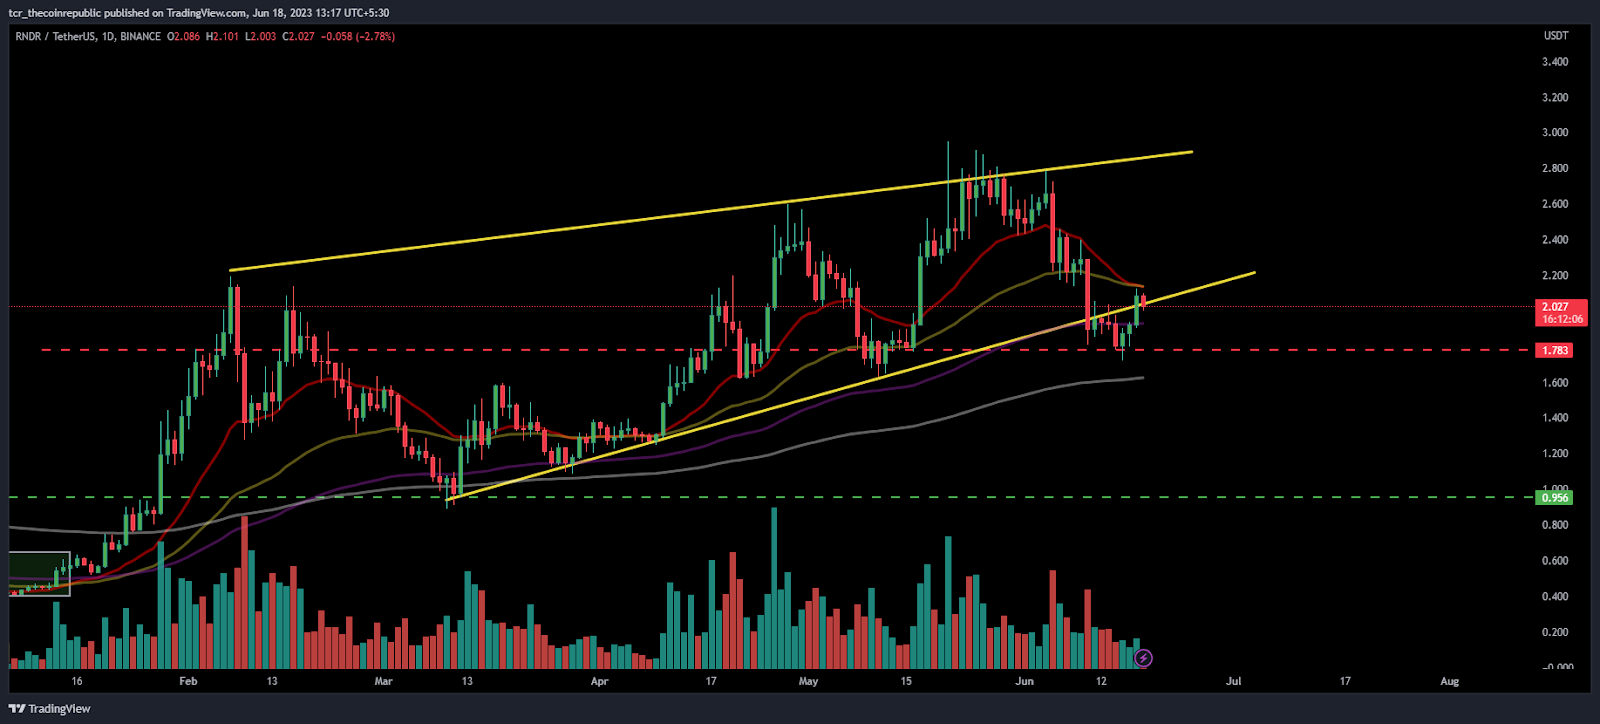
On the daily charts, the RNDR token showed a bounce from the support range near $1.700 where the token getting momentum and forming a hammer candlestick shows the intent of buyers and started to accumulate. Moreover, token is trading above the 200 day EMA and does not break the mark of $1.600, which indicates that there is strength remaining of bulls which are rescued in the last trading sessions.
As per the Fib levels, the RNDR token trades above the 50% level and willing to attain the 61.8% level which was near to $2.000. Moreover, RNDR is claiming the trendline and sustaining the gains.
The ongoing pattern shows that due to the market sentiment a correction was shown on the charts which led a downmove in the last trading sessions, but bulls again claimed the horizons and looked in perfect shape to reclaim the gains.
In the last session, a bounce was noted which led the token to trade above the trendline and started to fetch the 50 day EMA, which if surpassed then buyers will get fresh momentum and further gains. If follow-on buying arrives and the token maintains the gains above $2.000, then fresh revival can be there and the token will head towards the mark of $2.300.
What Technical Indicators Say?
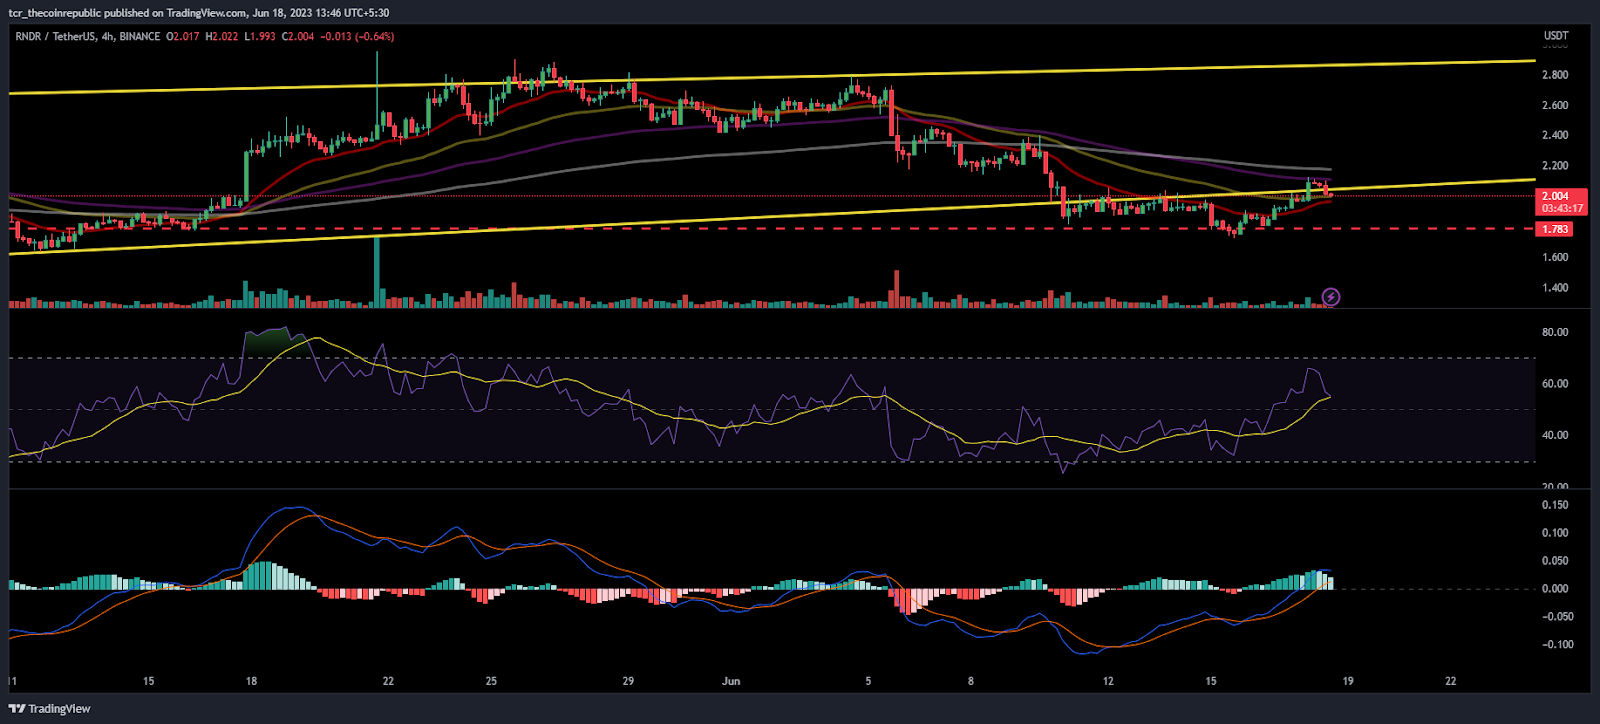
On the 4-hour charts, the token revamped from the support range and looking to beat the mighty bears now. The token starts to show their massive muscles and shining again above the neutrality.
The RSI is now floating above the neutral marks staying near 60,whereas a positive crossover on the curve is also noted.
The MACD indicator also shows green bars with a bullish crossover indicating the positive outlook.
Conclusion:
RNDR token is gaining momentum rebounded from the strong demand zone of $2.000 and starts to pump from the bottom.
Technical Levels:
Support Levels: $2.000
Resistance Levels:$2.500
Disclaimer
The views and opinions stated by the author, or any people named in this article, are for informational purposes only and do not establish financial, investment, or other advice. Investing in or trading crypto assets comes with a risk of financial loss.




