
 Zcash
Zcash Sui
Sui Celestia
 Quantus
 Injective
 Hyperliquid
 LayerZero
- The UNH price is trading at $479.05.
- The UNH price increased by +0.48% in the last 24 hours.
- The UNH year-to-date return is -8.77%.
UnitedHealth Group Inc is a health insurance organization that functions in four segments: OptumHealth, OptumInsight, UnitedHealthcare and OptumRx. It is the biggest health insurer in the US and has a market cap of around $446 billion.
Trend Analyzation
This month the trend was barely upward as the price was only up by 0.60% which shows a lack of proper momentum. By trend and price information history, we can say that UNH is underperforming since it is below 1%. The stock value surged by more than 331000% in all-time history, giving good returns to the investors’ money.
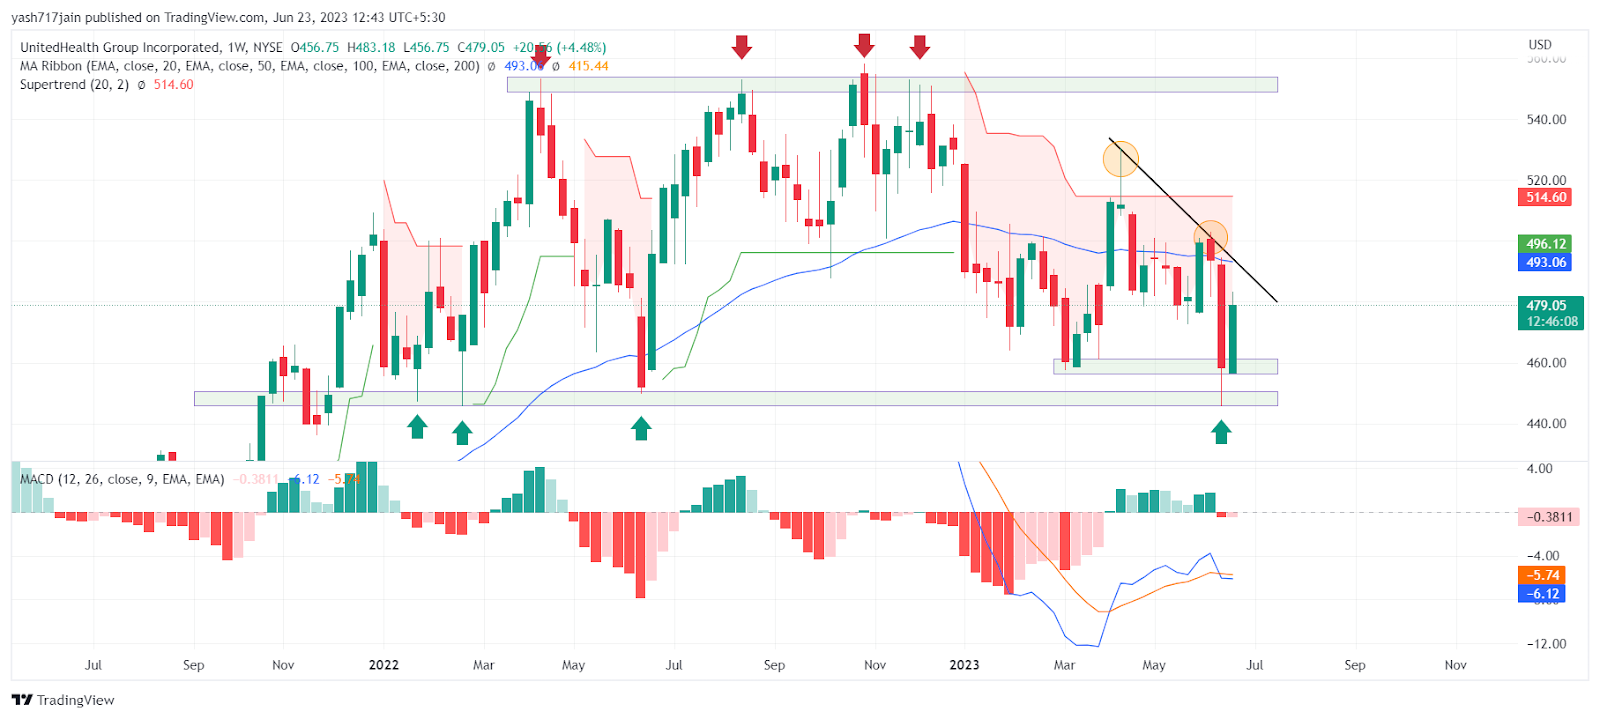
(Technical Analysis In 1-W Timeframe)
Source: UNH.1D.NYSE by TradingView
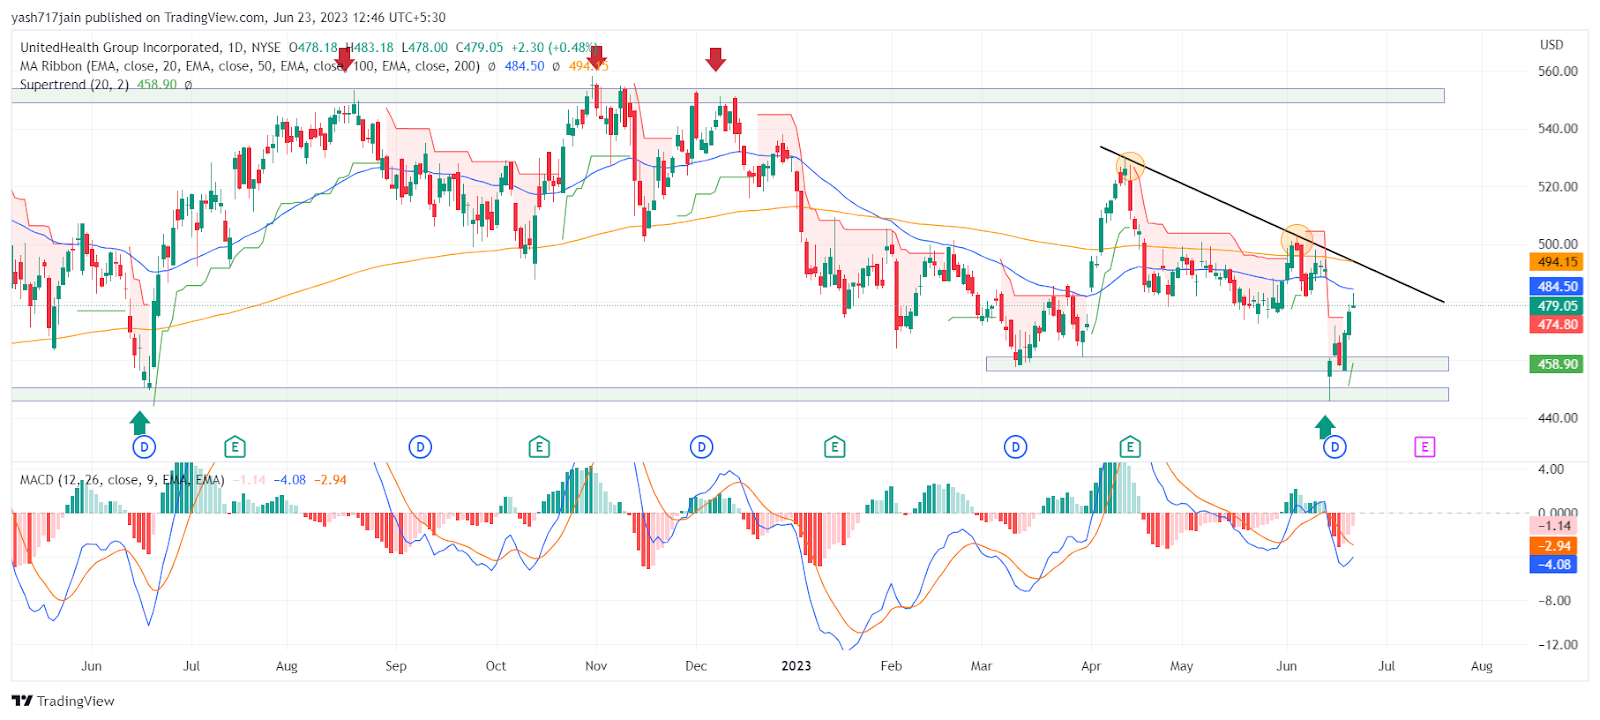
(Technical Analysis In 1-D Timeframe)
Source: UNH.1D.NYSE by TradingView
Trendline Analyzation
As per the trendline, it respected multiple support and rejection very well, taking exactly from the various drawn zones on the 1-D & 1-W charts. Recently, as observed on the chart, it took support from the support zone due to good volume on the stock. The price did move upward with good momentum but it also stayed below EMA’s which are resisting the price as well. Therefore, it can be interpreted that the stock has a big resistance above. It needs a considerable amount of volume to give good momentum to the stock.
Hence, we can observe that it took support exactly from our support zone and got rejected from our diagonal trendline, very effectively. Now, it’s again headed towards the diagonal trendline and it could take rejection soon from the same trendline again and reach our support soon & if the bears destroy this support zone the price can climb down even further soon. Therefore, It can reach $458 soon which is the nearest major support.
Supertrend
With the help of just two parameters: period and multiplier, this indicator works well. At period value 20 and multiplier value 2, it shows the continuous trend if it’s bullish or bearish. As shown in the chart, it’s bearish.
MACD
On the day of writing, the MACD line is already on the negative side and the signal line is also on the negative side of the MACD indicator. This highlights that the trend may continue downward. The indicator shows a bearish crossover in negative territory or precisely below the zero line. Hence, it can be inferred that the price may fall soon.
EMA
The price is going up on the 1D chart. It is below the 20, 50, 100 & 200 EMA (exponential moving average), which is resisting the trend and pushing it downwards. The sellers are stronger than the buyers which shows that the price is unable to reach above resistance levels as resistance is high by the bears. To change the direction, the price has to go up and stay above the 20, 50, 100 & 200 EMA. Hence, it can be inferred that the price might fall soon if support is destroyed.
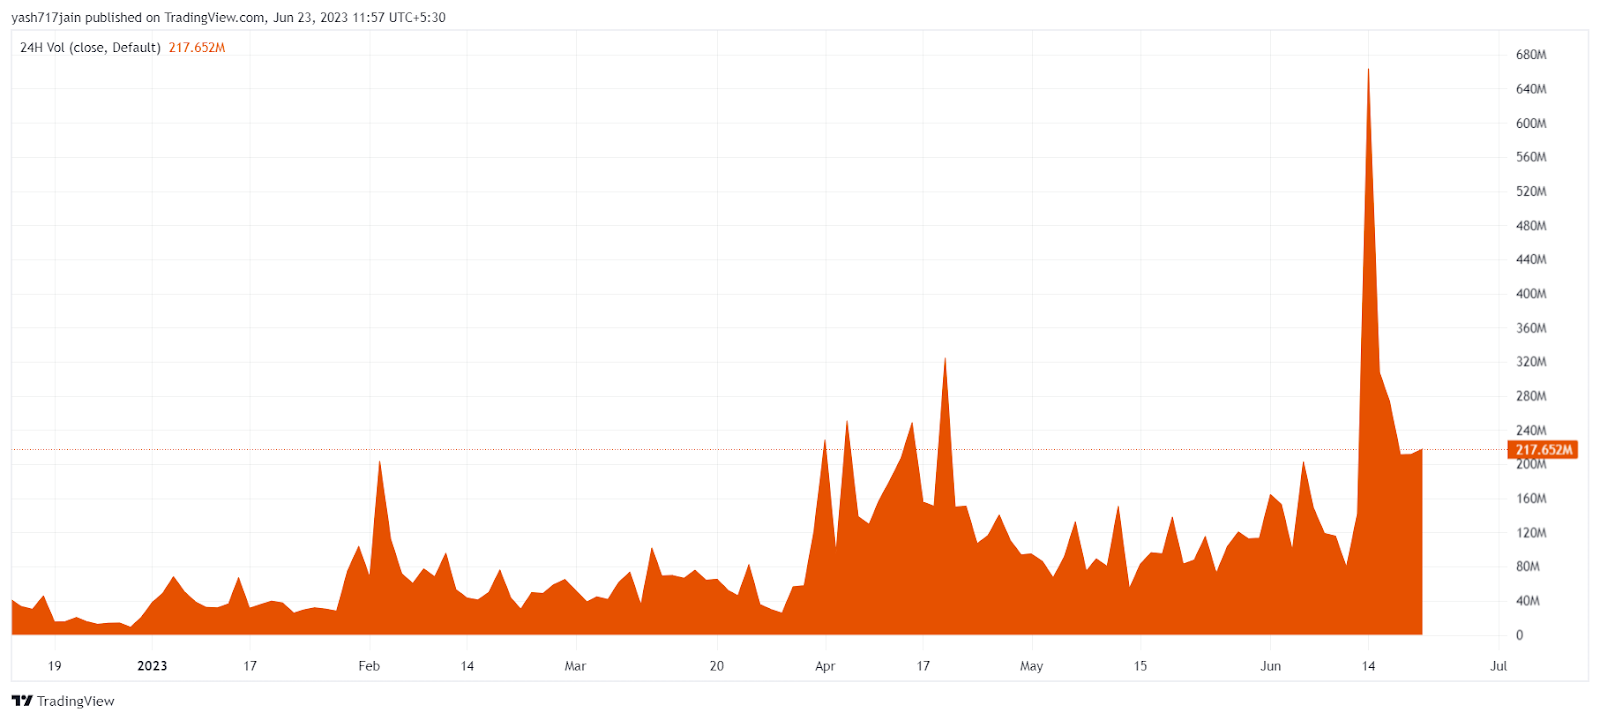
Volume Analyzation
The amount of UNH traded in a day is $217.65 Million. The trading activity is comparatively good in UNH which is the reason the price is taking support from the support zone. Also, we can observe on the volume graph that the volume has decreased thus it can not support price on a long-term basis. It can only push the price up if considerable volume comes in the future, if volume fails the stock then we can see its upcoming fall. Hence, it can be inferred that the price can fall if volume breaks.
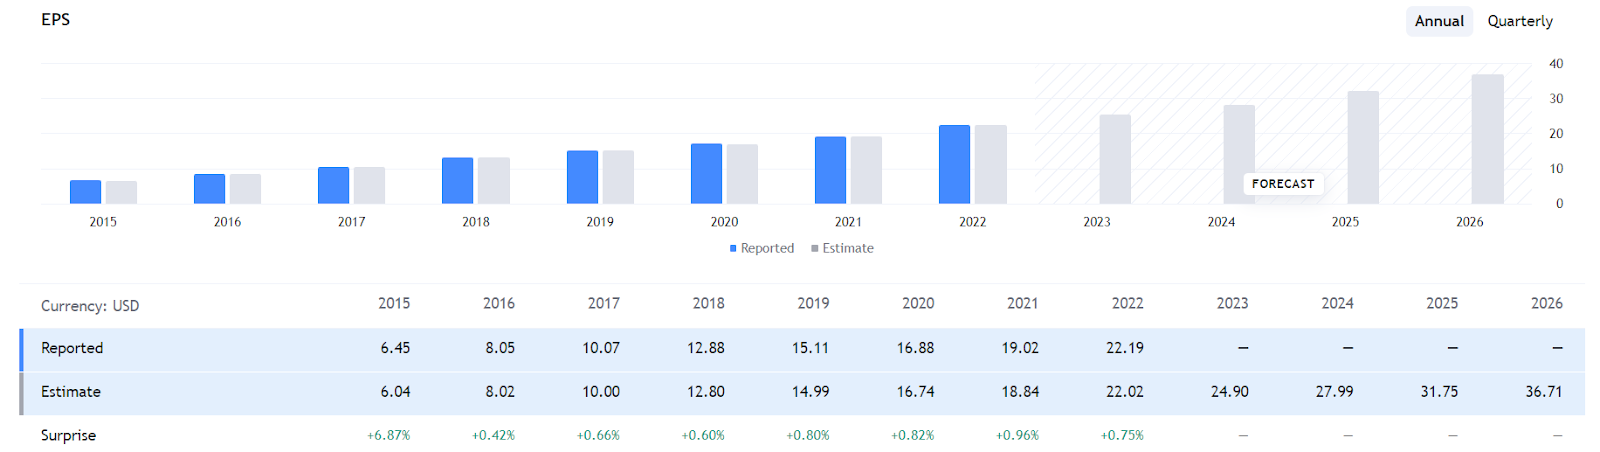
Fundamental Stats
- The UNH stock market capitalization is $446.01 Billion.
- The UNH stock price-to-earning ratio is 21.80.
- The UNH stock’s basic EPS is $22.15.
- The stock’s profitability net margin is 6.10%.
- The stock’s revenue is $324.16 Billion.
Conclusion
The UNH price as per the price action is bearish. Currently, the technical parameters indicate bearish pressure in the upcoming trading days. The investor’s and traders’ sentiments regarding UNH are bearish.
Technical Levels:
- The Nearest Support level is $458.
- The Nearest Resistance Level is $501.
Disclaimer
In this article, the views and opinions stated by the author, or any people named are for informational purposes only, and they don’t establish investment, financial, or any other advice. Trading or investing in cryptocurrency assets comes with a risk of financial loss.




