
 Injective
 Celestia
 streamoors
 Sui
Sui Pudgy Penguins
 Bitcoin
 Pearl
Pearl
- Polkadot Price Prediction suggests a significant rise is possible in the long run if certain conditions are met.
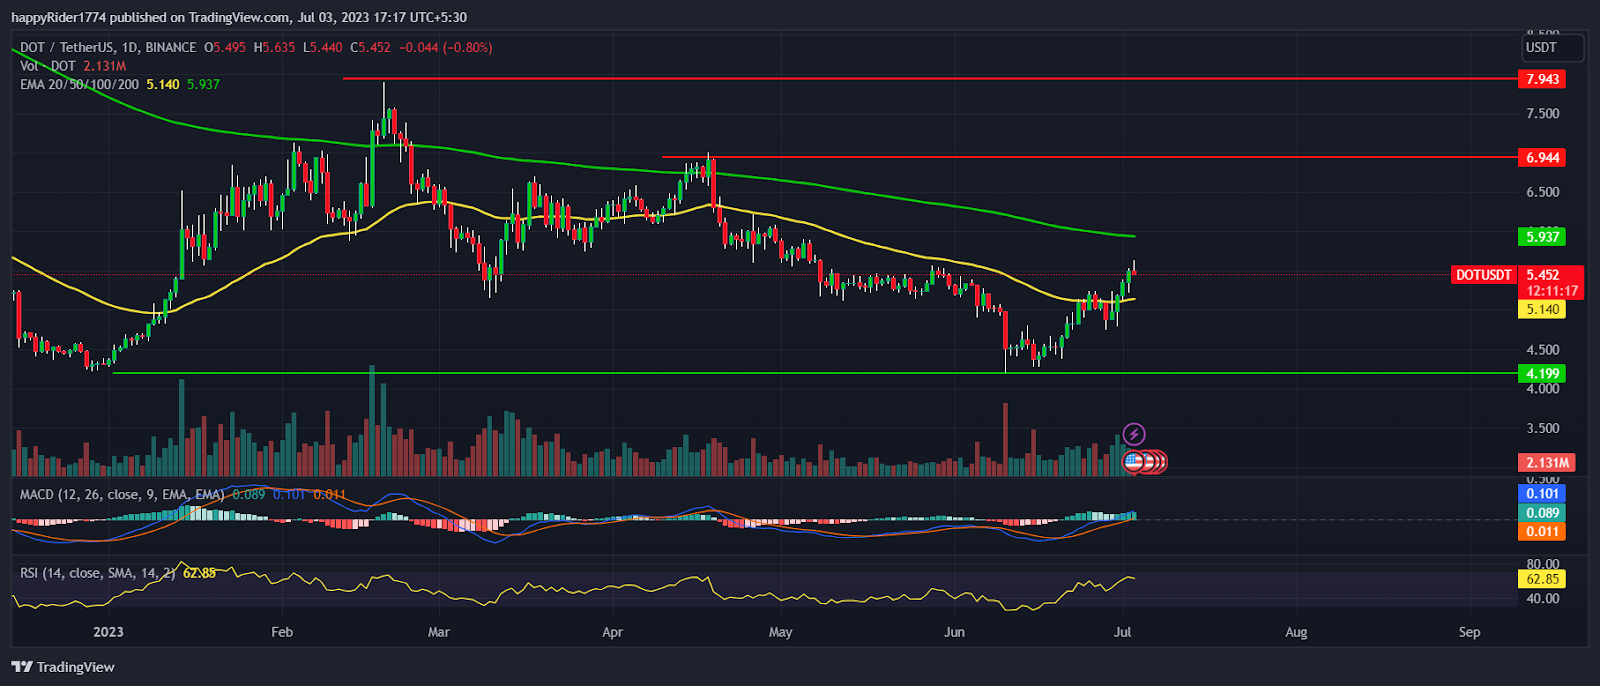
- DOT Price holds the 50 day EMA and is trying to test the 200 day EMA.
- The Polkadot Price recovered 30% approx from the recent swing low.
Polkadot Price Prediction stays bullish till it sustains above $4.00 and suggests a rise in the long run. DOT Price recovered 30% approx from the recent swing low and succeeded to break out of the $5.00 hurdle.
Polkadot Price managed to climb above the 50 day EMA shows the short term trend has reversed in the upward direction. However, the price is still below the 200 day EMA which will act as an immediate hurdle for the bullish traders.
In the mid of April, DOT Price faced a hurdle at the $7.00 and reverted in the downward direction. Since then prices began to decline by forming lower lows and corrected 40% approx. The downfall of Polkadot crypto halted near $4.00 and sellers faced difficulty to pull the prices further down.
After a little bit of consolidation, DOT Price took a U-turn and showed a decent recovery from lower levels. It indicates that responsive buyers are active near the demand zone and it will act as a strong support for the coming months.
Polkadot Price is trading at $5.452 with an intraday decline of 0.80%. The 24 hour volume to market cap is 2.78%.
Will Polkadot Price continue the recovery?
Polkadot Price has not performed well in the past few months and traded with the bearish bias. Recently, The overall market has improved which positively impacts the prices of DOT and other Altcoins.
Till Polkadot Price holds the $5.00 level the probability of continuing the recovery remains high. Well the price will gain positive momentum when buyers are able to break out of the $7.00 swing high hurdle.
On the other hand, if the price again drops below $5.00 then bears will try to pull it down to the yearly lows. If the crypto leader Bitcoin Price continues the upward momentum the overall market sentiment will remain bullish. It will positively impact the DOT and more recovery in price is possible.
DOT Price showed signs of bullish Trend Reversal
DOT Price formed a bullish hammer candle on the weekly time frame and showed the signs of bullish trend reversal. Slow and steady, DOT Price is recovering and support levels are shifting higher indicates the bulls are returning back to the track.
The MACD curve is rising higher and displaying a positive crossover indicates bullish momentum might continue for some more time. The RSI at 62 rising upward denotes the strength of bulls and more room for upside is open.
Conclusion
Polkadot Price Prediction suggests significant rise is possible in the long run. The DOT Price is into recovery mode and it is likely to continue for some more time. The technical analysis suggests, If DOT Price holds $5.00 level it might get doubled in 2024.
Technical levels
Resistance levels: $7.000 and $8.000
Support levels: $4.500 and $4.000
Disclaimer
The views and opinions stated by the author, or any people named in this article, are for informational purposes only. They do not establish financial, investment, or other advice. Investing in or trading crypto assets comes with a risk of financial loss.




