
 Dacity Coin
 Quantus
 Celestia
 Bitcoin
 Pearl
Pearl Hyperliquid
 Pons
Pons
- Linde Plc price is trading at $381.08 and the LIN price increased by 0.50% in the last 24 hours.
- The Linde Plc Ordinary Share (LIN), 52-week price bound range is $262.47 – $383.58.
The Linde Plc price highlights that the stock is trying to sustain near its all-time high level of $381.08 aiming to jump above hurdles. The Linde Plc price is trading with enormous bulls’ power keeping the stock in an uptrend for the last two months, LIN price took support on May 24th from major support with great momentum to surge above the previous resistance levels.
This month the stock performed well as it was up by 0.50%. Also, the LIN price was up by 16.84% in the last six months which highlights its good performance. Moreover, the Linde Plc Ordinary Share (NYSE: LIN) price year-to-date return is positive with an increase of 19.96%.
The market capitalization of LIN stock is $186.57 Billion and the total revenue is $33.36 Billion. Moreover, the stock’s basic EPS is $9.08 and the price-to-earnings ratio is 42.12.
Linde Plc Stock Price Technical Analysis
The Linde Plc Price indicates the amount of LIN share price traded in a day is $1.643 Million. As observed from the volume graph, the present buying volume is low in the stock but the price constantly moving upward.
As per price action in the long trend, it seems the price is following the channel and a bearish flag is observed which can be bothersome, but the buyers are still in the race and pushing the stock price upwards, for now, it can be inferred that the price might go up in the shorter trend and vice-versa in longer one.
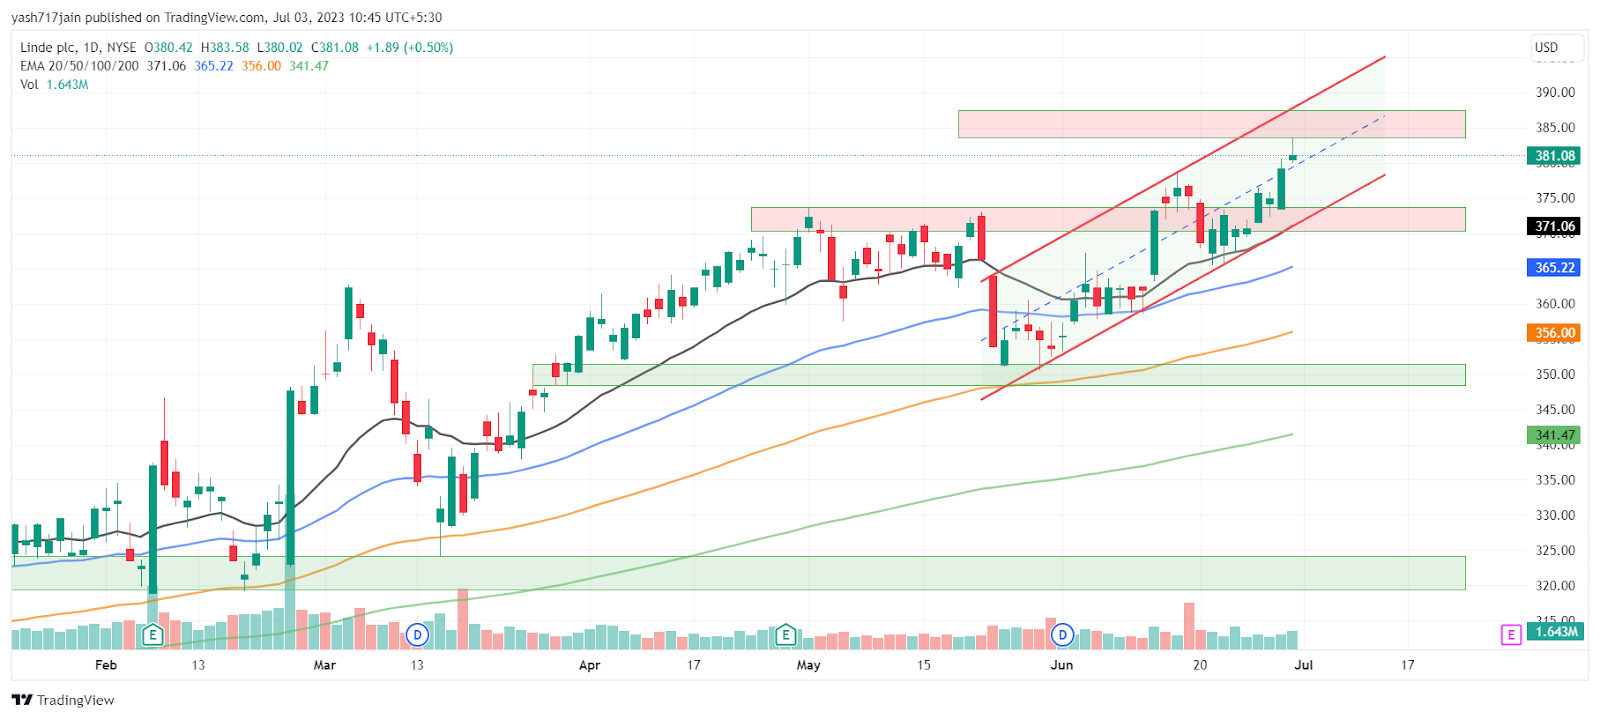
As of the day of publishing, the Linde Plc Ordinary Share (LIN) price is trading above the 20, 50, 100 & 200-day EMA (exponential moving average), which is supporting the LIN share price trend upwards. We can expect more upward move in the shorter trend of Linde Plc stock.
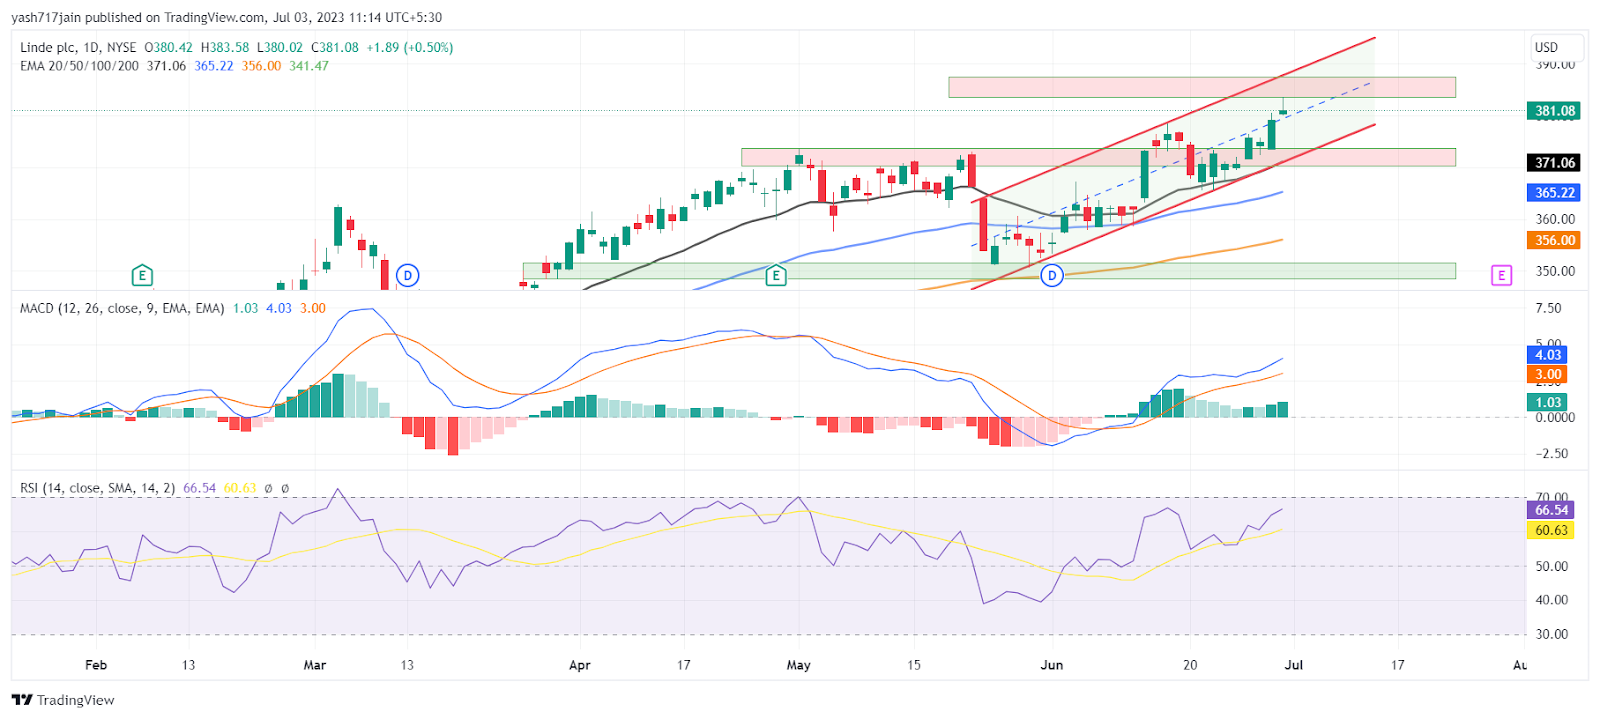
The MACD line at 4.03 and signal line at 3.03 is above the zero line, suggesting that the MACD is in positive territory and is giving bullish signals.
The current value of RSI is 66.54 points it took support on the 14 SMA line and headed upwards. The 14 SMA line is above the median line at 60.63 points which indicates an upward direction and bullish sentiment in the market.
Extraction
The Linde Plc Price indicates that the LIN stock is in an uptrend and waiting for more accumulation of buyers to surge above the nearest hurdles. The sentiments and perspectives of investors and traders regarding the LIN stock are bullish in the 1D timeframe. The technical extensions of Linde Plc Price suggest the continuation of the uptrend over the daily time frame chart. The LIN share price reflects an optimistic view at the moment. Major legitimate indicators MACD, RSI, and EMA, flaunt positive signals about the Linde Plc Price.
Technical Levels:
- The nearest support level is $351.50.
- The nearest resistance level is $387.50.
Disclaimer
In this article, the views and opinions stated by the author, or any people named are for informational purposes only, and they don’t establish the investment, financial, or any other advice. Trading or investing in cryptocurrency assets comes with a risk of financial loss.




