
 Quack AI
 NEAR Protocol
 Zcash
Zcash Celestia
 Pons
Pons Pudgy Penguins
 Bitcoin
- Cisco Systems Inc. (NASDAQ: CSCO) stock yields a dividend of 3.06%.
- The stock price of CSCO Systems is $50.99 at this time.
- The current market cap of Cisco Systems is $209.91 Billion.
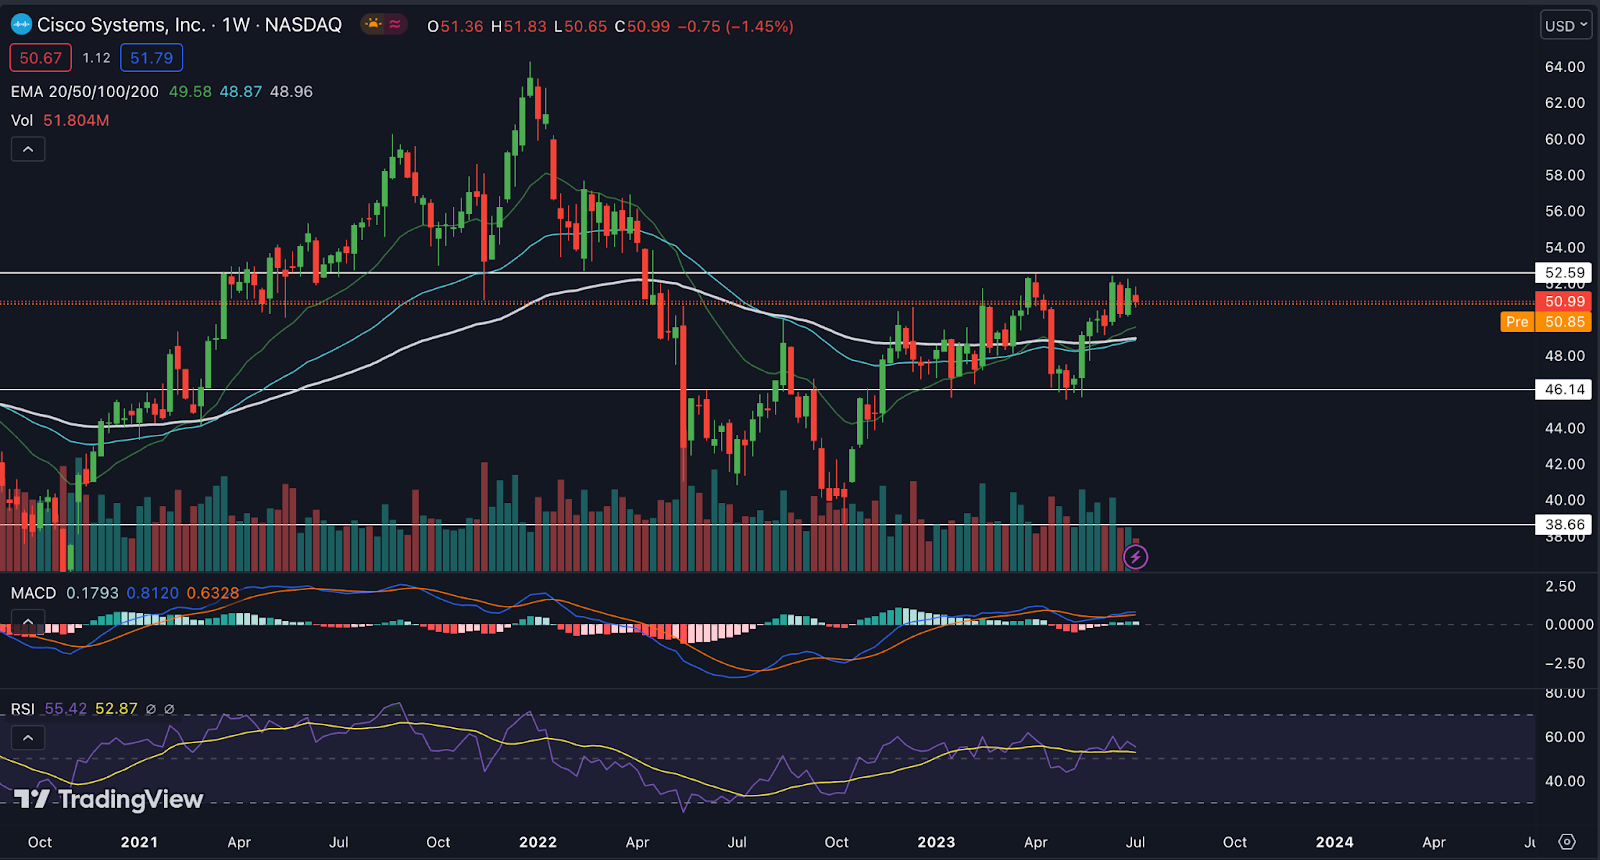
As per the Cisco Systems Inc. (CSCO) price analysis in the weekly timeframe the stock has a sharp decline, it fell around 40% from its high of $64.29 in December 2021 to a low of $40. However, the $40 level offered support, and a recovery phase with positive momentum of +36% in a few months followed. This demonstrates the presence of buyers and the strength of the stock.
At the time of writing, Cisco stock is currently up by just 0.4% and trading at $50.99. The $52.59 resistance level has been repeatedly tested but not broken yet. The overall chart pattern of CSCO indicates that the stock is in an uptrend.
The dividend payout ratio of Cisco Systems (CSCO) is 55% and the company consistently pays out a dividend of 3.06% annually. This can be a favorable factor for the Cisco Systems stock price.
Additionally, the P/E ratio of Cisco System Inc. (CSCO) is 18.1x which is lower than the peer average ratio of 28.7. This signifies that CSCO stock is priced at the right value.
Cisco Systems Inc. (CSCO) Stock Price Analysis
EMA
The price of Cisco stock is currently trading above all important weekly Exponential Moving Average (EMA) levels, such as the 20 EMA, 50 EMA, and 100 EMA. This is a positive indication that suggests the stock price may increase further.
MACD
The MACD indicator for Cisco (CSCO) shows a positive trend every week. The zero line is above the MACD line and the signal line. Additionally, green histograms are starting to appear, supporting the upward trend.
RSI
A potential signal of higher price movement is the Relative Strength Index (RSI) line passing the Simple Moving Average (SMA) line. Future price increases are probably in store.
Volume Analysis
As shown in the chart, Cisco Systems Inc.’s overall volume is rising, which indicates the presence of buyers from lower levels.
Conclusion
As pe the Ciscle Inc. price analysis we can conclude by pointing out Cisco’s advantageous market structure and expanding momentum. The price may break past a resistance level even though it is now being tested, according to the observed chart patterns. Indicators like MACD, RSI, and EMA, which predict a likely price gain in Cisco’s stock in the future, add credence to its optimistic outlook.
Technical Levels:
- Support – The current support level of Cisco Systems is $46.14.
- Resistance – The current resistance level of Cisco Systems is $52.59.
Disclaimer
The views and opinions of the author, or anyone named in this article, are for informational purposes only. They do not offer financial, investment, or other advice. Investing or trading crypto assets involves the risk of financial loss.




