
 Quack AI
 NEAR Protocol
 Quant
Quant Ondo
Ondo Zcash
Zcash Pearl
Pearl Sui
Sui
- Thermo Fisher Scientific Inc. stock price is trading below 20,50 and 100-day EMA levels.
- Thermo Fisher Scientific Inc. (TMO) stock price is currently trading at $516.85.
- Thermo Fisher Scientific Inc. (TMO)’s live market cap is $199.4 Billion.
Thermo Fisher Scientific Inc. (TMO) stands for Thermo Fisher Scientific Inc., a major international supplier of tools, supplies, and services for scientific research.
Trend Analysis
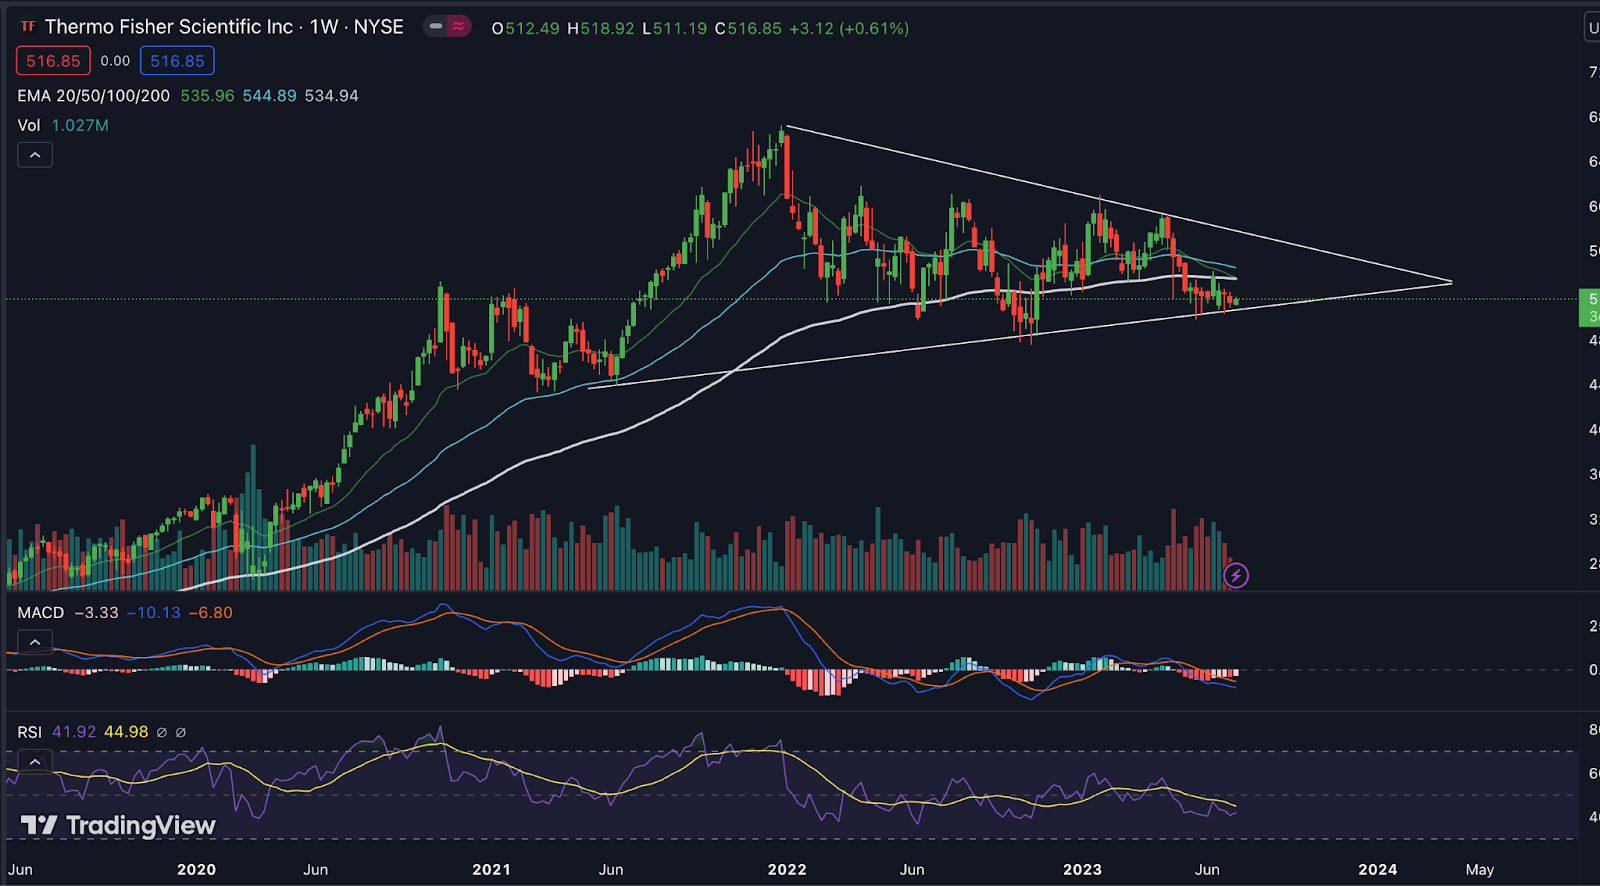
The stock is clearly in a downtrend at the moment, as shown by the weekly timeframe analysis of the Thermo Fisher Scientific Inc chart. Previously, the stock had been rising gradually over a long period of time, peaking at $872.34 in November 2021. The stock, however, had a -28% decrease during the course of the following year. With the current price movement forming a symmetrical triangular pattern, the market structure is weak and there is a greater likelihood of a downward move.
Thermo Fisher Scientific Inc (TMO) has experienced a negative growth rate in fundamentals over the past year of -7.4%. A further indication that the company may be expensive is that the Price-to-Earnings (P/E) ratio of 33.1x is greater than the fair P/E ratio of 28.2%. These elements suggest that Thermo Fisher Scientific Inc. (TMO)’s stock price is now trading below its fair value.
Thermo Fisher Scientific Inc. (TMO) Stock Price Analysis
EMA
On a weekly timeframe, Thermo Fisher Scientific Inc. (TMO) stock price is now trading below the 20, 50, and 200-day EMAs, which indicates that the stock is weak and the price might decline in the future.
MACD
On a weekly basis, Thermo Fisher Scientific Inc.’s MACD line is placed below the signal line which signifies a bearish momentum. Also, the presence of red histograms signifies an emerging bearish momentum.
RSI
RSI for Thermo Fisher Scientific Inc (TMO) is at 41.43 and the 14-day Simple Moving Average (SMA) line is placed at 45.46 below the median line, this means the RSI is line is below the SMA line which is a negative factor.
Volume Analysis
The volume of Thermo Fisher Scientific Inc. stock, as per the charts, is gradually decreasing, signifying a weakness is developing in the stock and buyers are taking less interest in buying.
Conclusion
According to the analysis, it comes to the conclusion that Thermo Fisher Scientific Inc. (TMO) has a weak market structure and a falling momentum. This negative momentum is supported by indicators like MACD, RSI, and EMA, which suggests that the price of Thermo Fisher Scientific Inc.(TMO) may decline in the future.
Technical Levels
- Support -Thermo Fisher Scientific Inc (TMO) support level is $490.
- Resistance – Thermo Fisher Scientific Inc’s (TMO)resistance level is $594.
Disclaimer
The views and opinions of the author, or anyone named in this article, are for informational purposes only. They do not offer financial, investment, or other advice. Investing or trading crypto assets involves the risk of financial loss.




