Quack AI
 Pudgy Penguins
 Starknet
 Pearl
Pearl Sui
Sui Celestia
 Quantus
- Trade Desk Stock Price (NASDAQ: TTD) rises 11% approx in the current week.
- TTD Stock Price sustains above 200 day EMA and also displayed a golden crossover.
- Trade Desk Inc Stock Monthly Option Chain Analysis.
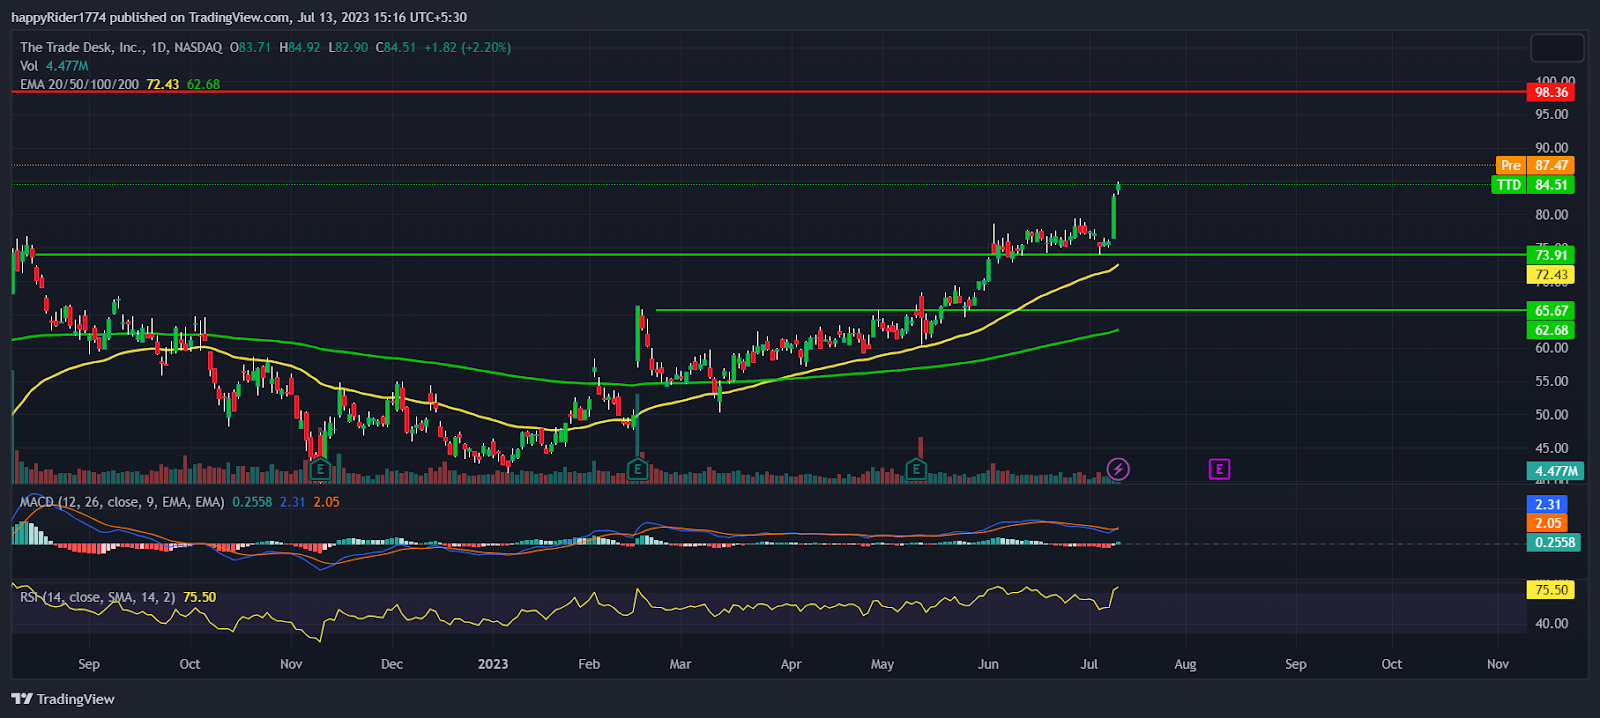
Trade Desk Stock Price (NASDAQ: TTD) rises 11% in the current week and hits a 52 week high. It broke out of the $80.00 hurdle and formed a bullish continuation pattern.
TTD Stock Price sustains above the 50 and 200 day EMA showcase uptrend. The EMAs displayed a golden crossover which further boosted the confidence of investors.
Trade Desk Stock Price is rising upward by forming higher high swings shows the dominance of buyers. If any short term sell off arrives then the probability of bounce back remains high.
Trade Desk Inc released previous quarter earnings on May 10, 2023. It reported an EPS of 0.23 and revenue of $382.803 Million. Company beats the EPS estimate by 83.46% and revenue by 5.19%. It triggered the positive sentiment and stock prices reacted positively after earnings.
TTD stock gained momentum and rallied 30% after earnings. Till the price is sustaining above the $65.00 any short term correction is likely to get absorbed. Well, TTD Stock prices look mildly over stretched so minor consolidation is also possible.
Trade Desk Stock closed the previous session at $84.51 with an intraday rise of 2.20%. The market capitalization stands at $41.31 Billion.
What’s the Option Chain indicate in Trade Desk Stock?
Trade Desk Stock Price performed well in the past few months and generated a decent return for its investors. However, The July month option chain shows that the 85.00 level might act as a strong hurdle.
The ATM Strike 85.00 Call open interest is 3533 vs the Put open interest is 123. The Call sellers are more active as compared to Put shows mild bearishness. The strike of 90.00 holds the highest Call OI build up of 5370.
Therefore, If buyers break out of the $85.00 hurdle then $90.00 will be the next hurdle. The strike of 80.00 holds highest Put open interest build up of 1363 contracts shows $80.00 will act as an immediate support.
TTD Stock: Call Unwinding possible?
TTD Stock Price is near to 52 week high. So the bullish momentum might continue. But as the time passes the clear view of option traders will be visible. If the TTD Stock price faces rejection in the range between $85.00 to $90.00 then Call OI build up will increase.
However, if the price holds the $85.00 then addition in the Put Open Interest might be visible. At the same time the unwinding of Call is also possible. The Put Call volume ratio is 0.58 and Put/Call open interest ratio is 0.96.
Conclusion
Trade Desk Stock Price (NASDAQ: TTD) rises 11% and is racing toward the fresh 52 week high. Till Prices hold $65.00 any short term down move will have a high probability of bounce back.
The technical analysis suggests prices are in bulls grip and more upward momentum is possible.
Technical levels
Resistance levels: $90.00 and $98.00
Support levels: $73.00 and $65.00
Disclaimer
The views and opinions stated by the author, or any people named in this article, are for informational purposes only. They do not establish financial, investment, or other advice. Investing in or trading crypto assets comes with a risk of financial loss.