
 streamoors
 IGNITION
 Injective
 Aerodrome Finance
 ZKsync
 Collector Crypt
 Sui
Sui
- EOS is currently trading at $0.7305.
- EOS’s live market cap is $800,913,026.
- EOS’s price is trading below the 20-day, 50-day, and 100-day EMA levels.
EOS is a blockchain-based platform that supports decentralized apps (dApps) and smart contracts. For developers to construct and distribute their apps, it aims to provide a versatile and user-friendly infrastructure.
The primary goal of EOS is to address some of the scalability issues that Ethereum and other blockchain platforms face. The uses the consensus technique known as Delegated Proof-of-Stake (DPoS) that provides faster transaction processing and higher throughput.
Trend Analysis
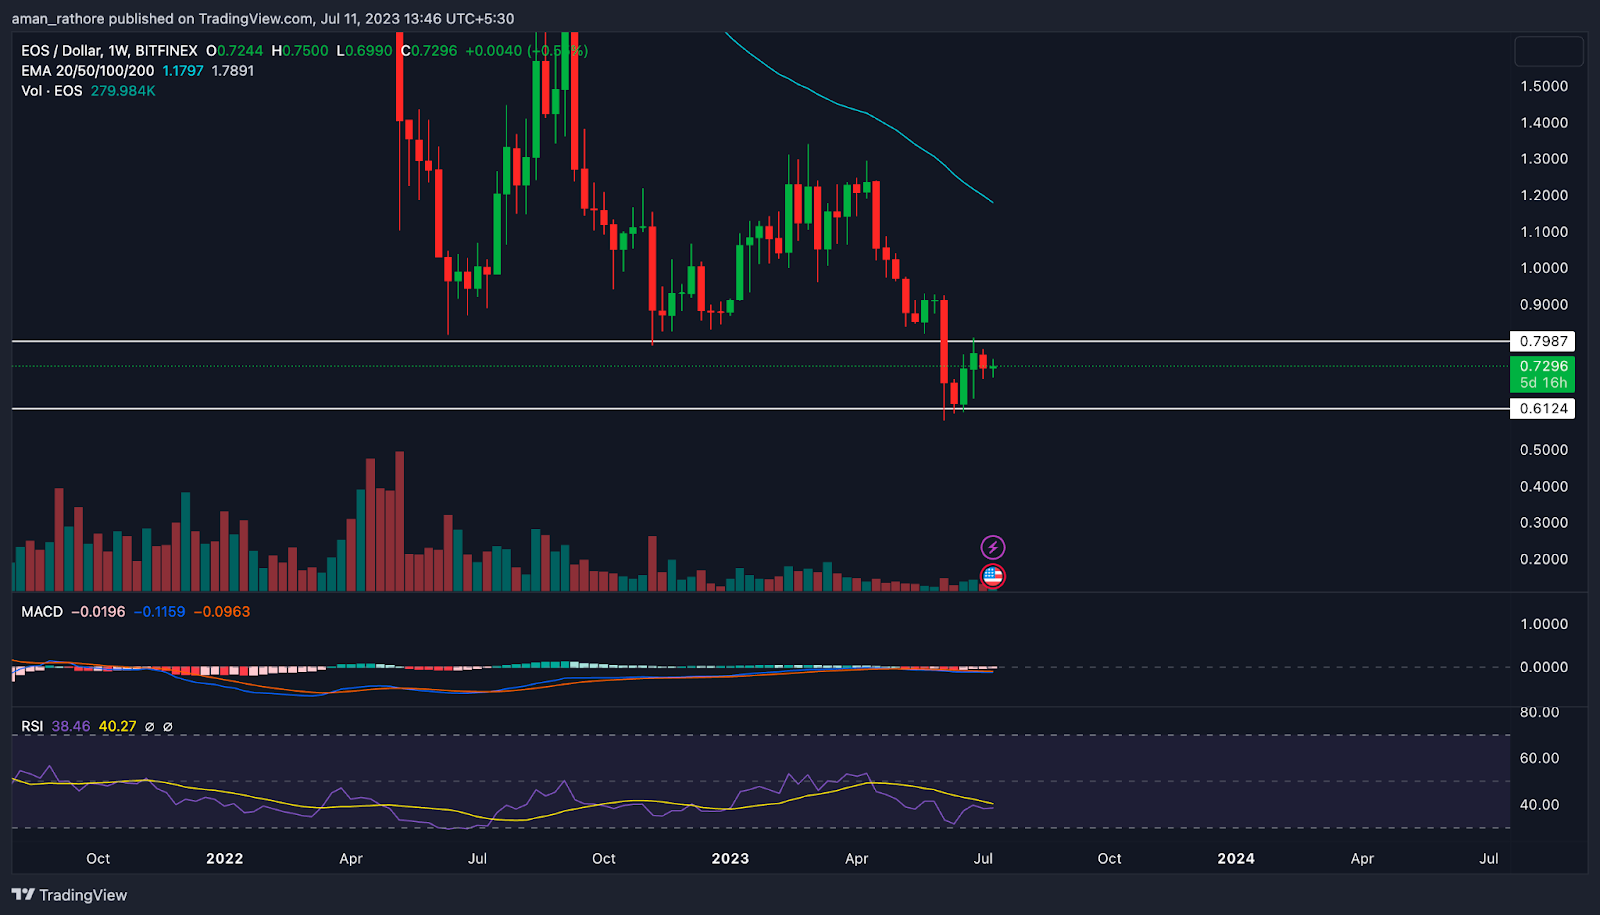
Based on previous price information, EOS is currently in a downward trend. EOS’s price has dropped 10.90% during the past ten days, indicating that its present performance is weak. EOS hit a high of $23.0290 about four years ago. It has since dropped by -97.94%.
As previously mentioned, the lack of notable volume indicates that there aren’t enough buyers due to the pessimistic market views. This might be the cause of the coin’s poor performance.
The price of EOS is currently trading near the resistance and the price is highly likely to fall as there is no positive strength development that can be observed in the coin and the price has also got rejected from the resistance level even after many attempts. Indicating a rise of a bearish move.
EOS Price Analysis
EMA
In the daily time frame, the price of EOS is currently trading below both the 20-day and 50-day exponential moving averages, which is a bearish sign. Sell-side investor sentiment and bearish momentum are focused .
MACD
Move-Average Convergence Divergence for EOS also indicates bearishness and conveys a negative message every week. The MACD line is at -0.1210 and the signal line is at -0.0916; both of these values are below the zero line and show that the MACD is in the negative zone and will move in a bearish direction.
RSI
A momentum oscillator called the RSI gauges the rate and size of price fluctuations. It oscillates between 0 and 100, with readings above 70 indicating overbought conditions and below 30 indicating oversold regions. There is bearish momentum in the market as indicated by the proximity of the 14 SMA line to the median line at 31.07 and the present reading of the RSI at 50.66.
Volume Analysis
The EOS 24-hour trading volume is $160.04 Million with a decrease of -6.92% in 24 hours. This indicates a reduction in market activity and a lack of buyers’ interest in the current market scenario. This might lead to a decline in price.
Conclusion
The EOS coin as per the analysis, is negative. The RSI indicator is giving neutral indications, indicators like the EMA and MACD are producing negative signs. The coin’s negative perception grew as a result. Currently, there isn’t much interest from investors in buying . The pricing of EOS at the moment paints a dismal image for the near future.
Technical Levels
Support – The current support level of the EOS is $0.6124.
Resistance –The current resistance level of the EOS is $0.7987.
Disclaimer
The views and opinions of the author, or anyone named in this article, are for informational purposes only. They do not offer financial, investment, or other advice. Investing or trading crypto assets involves the risk of financial loss.




