
 NEAR Protocol
 Bitcoin
 Aerodrome Finance
 Pearl
Pearl Uniswap
 Quantus
 Pudgy Penguins
- Tezos (XTZ) is down by -2.60% over the past 24 hours, trading at $0.8157.
- The current market cap of Tezos (XTZ) is $770,400,476.
- The price of Tezos (XTZ) has been below the 20 and 50-day exponential moving averages.
Tezos (XTZ) is a cryptocurrency and blockchain platform that makes use of a novel self-amending protocol to facilitate the creation of decentralized applications and smart contracts. Tezos leverages on-chain governance and formal verification to offer developers a reliable and secure environment.
Tezos’ Proof-of-Stake consensus mechanism enables token holders to participate in block validation and earn rewards by staking XTZ tokens. This strategy improves the network’s scalability and security.
Trend Analysis
The data indicates that the price of Tezos (XTZ) is now moving downward. The price dropped significantly over the next one and a half years by almost 93% after peaking at $9.1383 in October 2019. The price has been falling ever since.
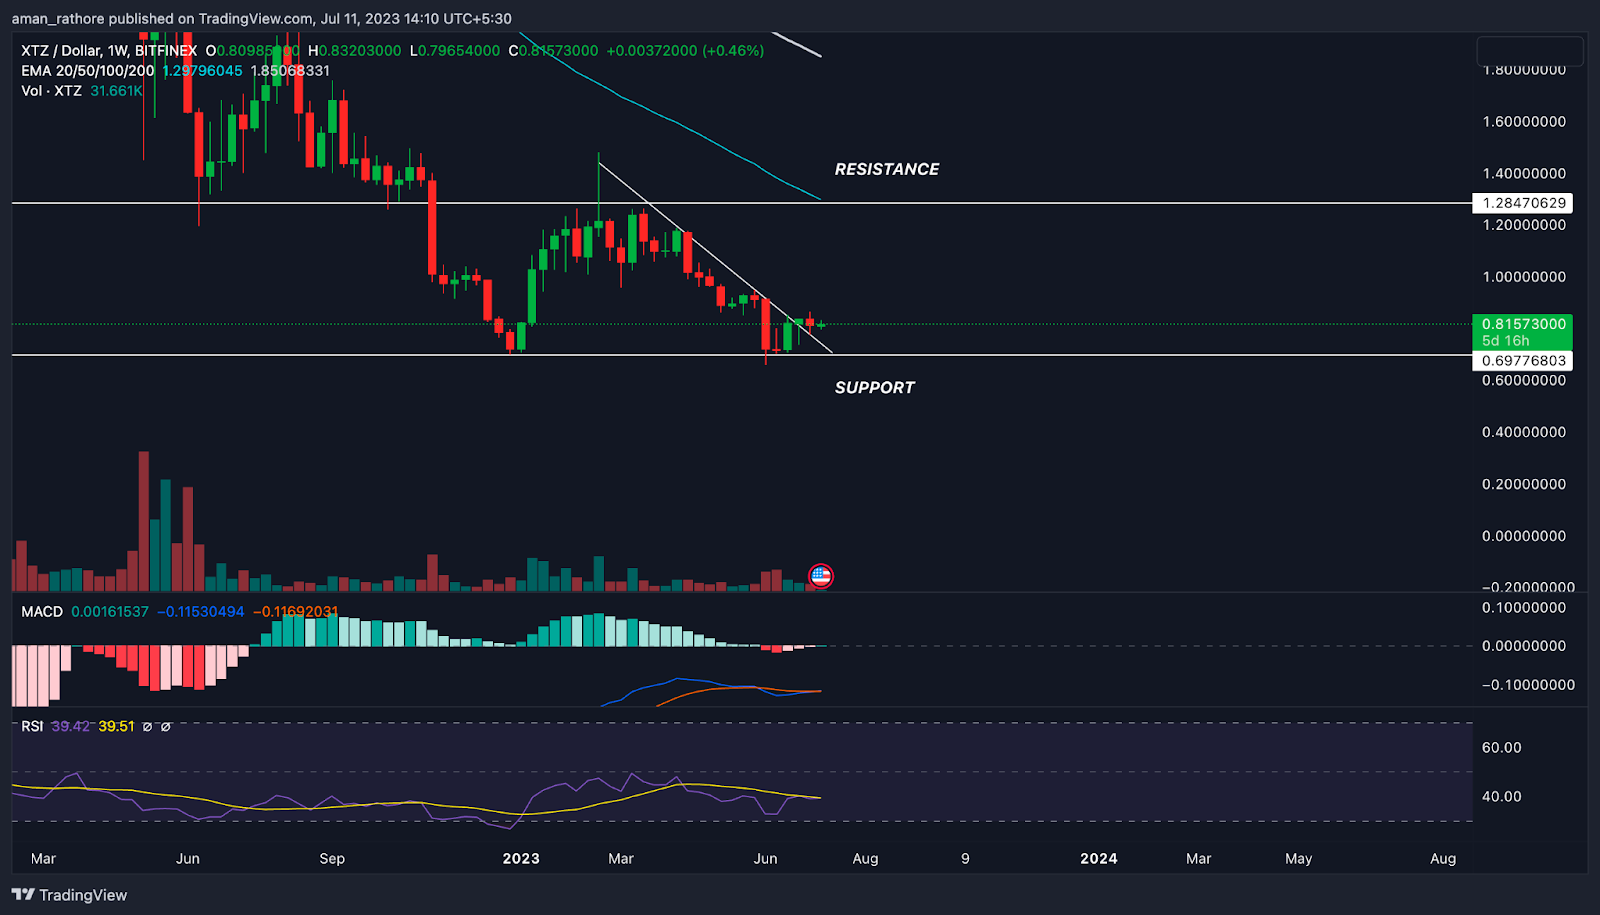
After the sudden dip, Tezos (XTZ) found support at the $0.69 level. It made an effort to buck the trend, but $1.2847 provided resistance. The price is still trading inside this range after numerous attempts to break out above the resistance level failed.
It is very likely that the price of Tezos (XTZ) will continue to fall in the near future due to the weak overall market structure and the development of a negative pattern.
Tezos (XTZ) Price Prediction
EMA
On the weekly chart, the price prediction for XTZ shows that it is currently trading below both the 20-day and 50-day Exponential Moving Average (EMA) lines.this indicates a negative momentum.
MACD
Tezos (XTZ) is currently trending downward on a daily basis as the MACD line is currently below the signal line. Red histograms show a trend that is veering more and more to the negative side. As a result, it demonstrates that there is a higher chance that Tezos (XTZ) prices will continue to drop in the near future.
RSI
As per the RSI indicator, Tezos’s momentum is currently negative, as seen by the current RSI value of 37.77, and the 14-day SMA line is situated close below the median line at about 39.39. These indicators suggest that there is a chance that the price of Tezos will continue to decrease in the near future.
Conclusion
In conclusion, a careful analysis of the weekly technical indicators for the price prediction of Tezos (XTZ) reveals contradictory indications that skew downward. The RSI signals that there may be an overbought scenario, which calls for caution despite the MACD’s negative indication. The EMA analysis further supports the existence of a recent negative trend.
Technical Levels:
- Support Level – $0.69776803.
- Resistance Level -$1.28470629.
Disclaimer
All thoughts and opinions stated in this article, whether by the author or anybody else who is referenced, are only for informative reasons. They don’t offer any advice on money, investments, or anything else. When buying or trading cryptocurrencies, there is a risk of financial loss.



