
 Dacity Coin
 Zcash
Zcash Celestia
 Bitcoin
 Pearl
Pearl Injective
 Pons
Pons
- Comcast’s stock price has been above the 20- and 50-day Exponential Moving Average.
- Comcast’s (NASDAQ: CMCSA) stock price is currently trading at $43.30.
- Comcast (CMCSA)’s live market cap is $180.52 Billion.
Comcast’s (NASDAQ: CMCSA) stock price is currently moving in an uptrend direction. The price is forming a higher-high pattern and moving up with good volume.
Comcast (CMCSA) stock has a market capital of $180.51 Billion with a revenue of $120.11 Billion. The CMCSA stock has a P/E of 33.18 and an EPS of 1.31. This indicates that the stock’s earnings are in positive figures.
In spite of reductions in prices in the past, Comcast’s price has been steadily rising since October 2022.
Comcast (CMCSA) had a record high of $61.57 in September 2021 before dropping quickly to $28.38, or almost 54% in just a year. The stock has subsequently started to show indications of improvement, finding support near the 28% mark.
Given the lack of imminent obstacles, it is quite likely that Comcast’s price will keep climbing and eventually reach $62 based on the current trend. The basic structure and pattern of Comcast’s price movement indicate that the stock has a promising future.
Comcast (CMCSA) Stock Price Prediction
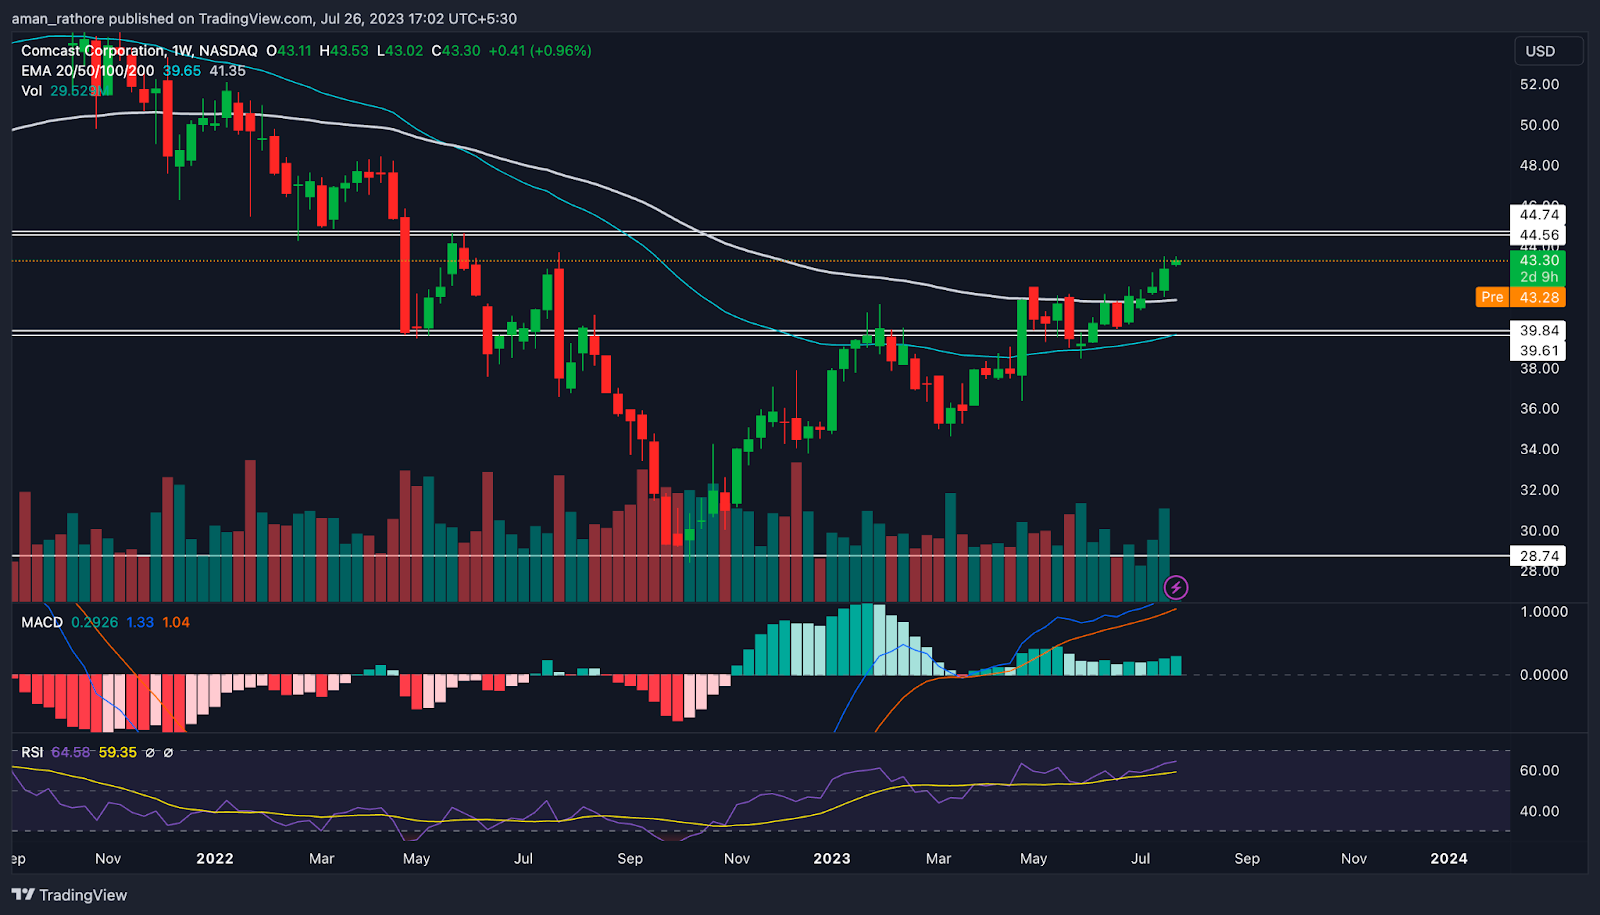
The CMCSA price is trading above the 50-day and 100-day Exponential Moving Averages (EMA), and the price of Comcast stock is currently exhibiting a strong bullish trend. This suggests that the market is bullish and that price increases may continue.
Comcast’s optimistic projection is supported by the Moving Average Convergence Divergence (MACD) indicator, which also shows upward trends. The MACD line is above the zero line, the histogram is green, and there is a good chance that the price will rise in the future.
Comcast’s RSI is close to 65, but not completely oversold. This suggests that the stock’s price will continue to rise and acquire momentum in the future.
The chart shows that Comcast’s stock volume is increasing in addition to technical indicators. This increase in volume suggests that the buyers are taking interest in the stock and prices might rise in the near future.
Conclusion
As per the analysis, it can be concluded that the Comcast (CMCSA) stock price is currently moving in an upward direction and the price is forming a positive pattern. The indicators are also indicating a further move in an upward direction. The revenue of stock is also increasing, this further suggests that the stock price might rise in the upcoming days.
Technical Levels:
- Support Level – $39.84.
- Resistance Level – $44.5.
Disclaimer
The views and opinions of the author, or anyone named in this article, are for informational purposes only. They do not offer financial, investment, or other advice. Investing or trading crypto assets involves the risk of financial loss.




