
 streamoors
 IGNITION
 NEAR Protocol
 Injective
 Pearl
Pearl LayerZero
 Quantus
- The price of Sandbox (SAND) is currently trading at $0.43.
- The 24-hour volume of SAND is $32,483,985 which decreased by 127.33% in 24 hours.
- The Sandbox price is currently trading below 50-day and 100-day EMA levels.
The market capital of the SAND coin is $831,945,190 with a decrease of 7% in today’s market session. The coin has made a 52-week high of $1.43 and a 52-week low of $0.36.
According to the Sandbox (SAND) price prediction, the cryptocurrency is showing possible symptoms of a trend reversal. After peaking at $0.902 in February 2023, the price started to decline and plummeted by 61% over the subsequent four months. However, the price took support at the $0.36 level.
Currently, the coin price is moving in a range with the resistance around $0.482 and support at $0.362. The Sandbox coin (SAND) price has reversed after touching the resistance level. This indicates that the price is facing weakness and it is unable to break above.
The overall structure of the SAND coin is forming a weak structure and this might lead to a further decline in the price in the upcoming days.
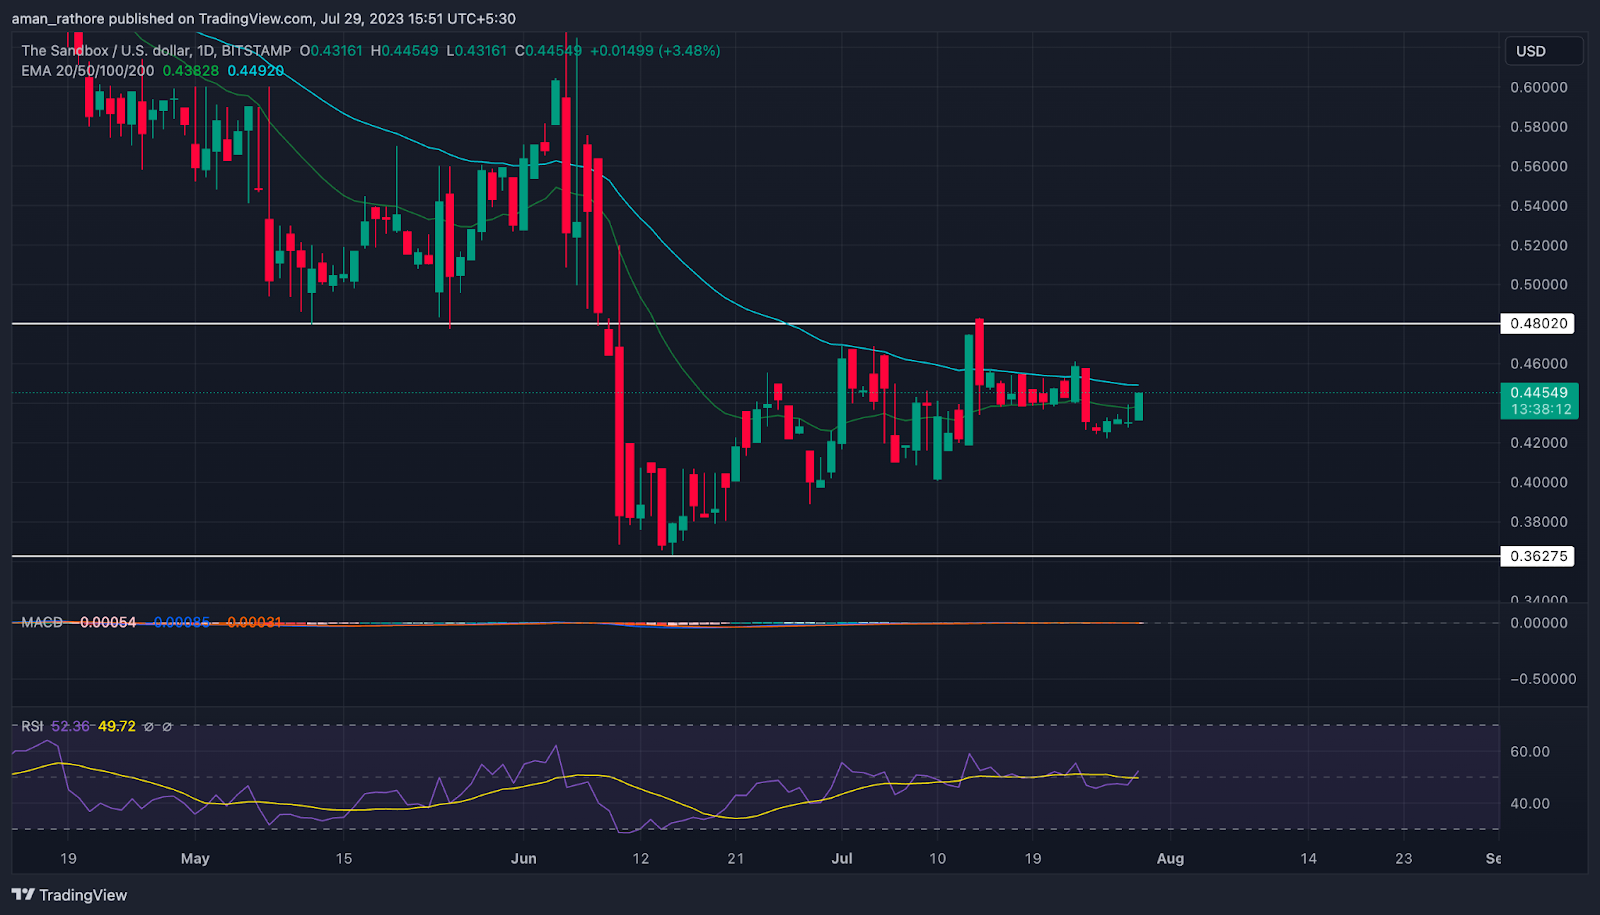
The Sandbox (SAND) Price Analysis
EMA
The Sandbox (SAND) price is currently trading below the 50-day and 100-day EMA levels. This indicates that the coin is losing its strength and the price might fall in the upcoming days.
RSI
The Sandbox (SAND)’s Relative Strength Index (RSI) line is currently below the Simple Moving Average (SMA) line, indicating a possible likelihood of a downward move. This means that the SAND crypto may continue to experience selling pressure and downward momentum in the near future.
MACD
MACD line is trading below the single line indicating further signs of bearishness. There is also the formation of a red histogram which is a negative factor.
Volume
The volume of the SAND crypto coin appears to be decreasing as per the charts. This indicates that the bears are active and buyers are not taking interest. This factor might lead to a further decline in coin price in the future.
Technical Levels
- Support Level: $0.36.
- Resistance Level: $0.48.
Conclusion
As per the analysis, the overall structure of The Sandbox price prediction is developing a bearishness. The price faced rejection from the resistance level. The indicators are also supporting the movement in the negative direction in the upcoming days. The volume of the coin is also emerging to be decreasing by 27% in the last 24 hours. Hence, the coin is negative and the price is likely to fall.




